Quickly surface the numbers that matter—right where you work. Meta Ad Widgets let you display clicks, conversions, spend, and top-performing campaigns directly inside any Patient Copilot dashboard or custom report. Use built‑in filters and charts to compare results across campaigns without spreadsheets or switching tools. * * * ## Prerequisites & Access Before adding widgets, confirm your plan access and connection status so data appears as expected. - A Meta ad account must be connected in Settings → Integrations → Facebook (LeadConnector). - Ensure LeadConnector permissions are granted for the Business Manager, ad account, and pages you intend to report on. - Dashboards & Reports access: verify users have permission to view or edit dashboards and to create/schedule reports. * * * These widgets visualize the core numbers advertisers use to gauge success. Pair spend-based metrics with outcome metrics to keep efficiency front and center. | Metric | Definition |
| --- | --- |
| Website Purchases | Purchases completed on your website from users driven by social ads traffic. |
| Conversions | Actions attributed to your ads (e.g., purchases, sign-ups) as defined by your Meta setup. |
| Meta Ad Clicks | Total clicks on your Meta ads. |
| Amount Spent | Total ad spend in the selected date range. |
| Average CPC (Cost Per Click) | Average amount paid per click. |
| Cost Per Conversion | Average cost to generate one conversion. |
| Ad Impressions | Total number of times your ads were shown. |
| Reach | Unique users who saw your ads. |
| Average CPM (Cost Per Mille) | Average cost per 1,000 impressions. |
| CTR (Click-Through Rate) | Percentage of impressions that resulted in a click. | * * * Table‑style widgets automatically rank campaigns so you can double‑down on what works.
| Widget | Definition |
| Top Campaigns by Ad Spend | Campaigns ranked by the highest advertising spend. |
| Top Campaigns by Conversions | Campaigns that drove the most conversions. |
| Top Campaigns by Website Purchases | Campaigns that resulted in the most website purchases. |
| Top Campaigns by Ad Clicks | Campaigns that generated the most clicks on ads. |
| Top Campaigns by Impressions | Campaigns with the highest number of ad impressions. |
| Top Campaigns by Reach | Campaigns that reached the most unique users. |
* * * Both environments use the same Meta metric library; choose based on how you need to consume and share insights. -
Dashboard — Best for at‑a‑glance monitoring throughout the day. Widgets live on a sub‑account dashboard and
update automatically. -
Custom Reports — Best for scheduled email delivery and packaged insights. Build layouts with Meta Ad widgets, then schedule to stakeholders as needed. (Note: exported formats and email previews may differ based on content types.) * * * Get connected and start visualizing performance in a few minutes. The exact steps to add widgets to a dashboard and build a custom report your team or clients can receive on a cadence. ###
1) Add Widgets to a Dashboard 1. In your
Sub-Account, navigate to the Dashboard and click the blue button in the top-left corner to open the desired dashboard.!(
https://assets.patientcopilot.ai/e75b867bcf2039b3.png) 2. Click
Edit Dashboard →
Add Widget.!(
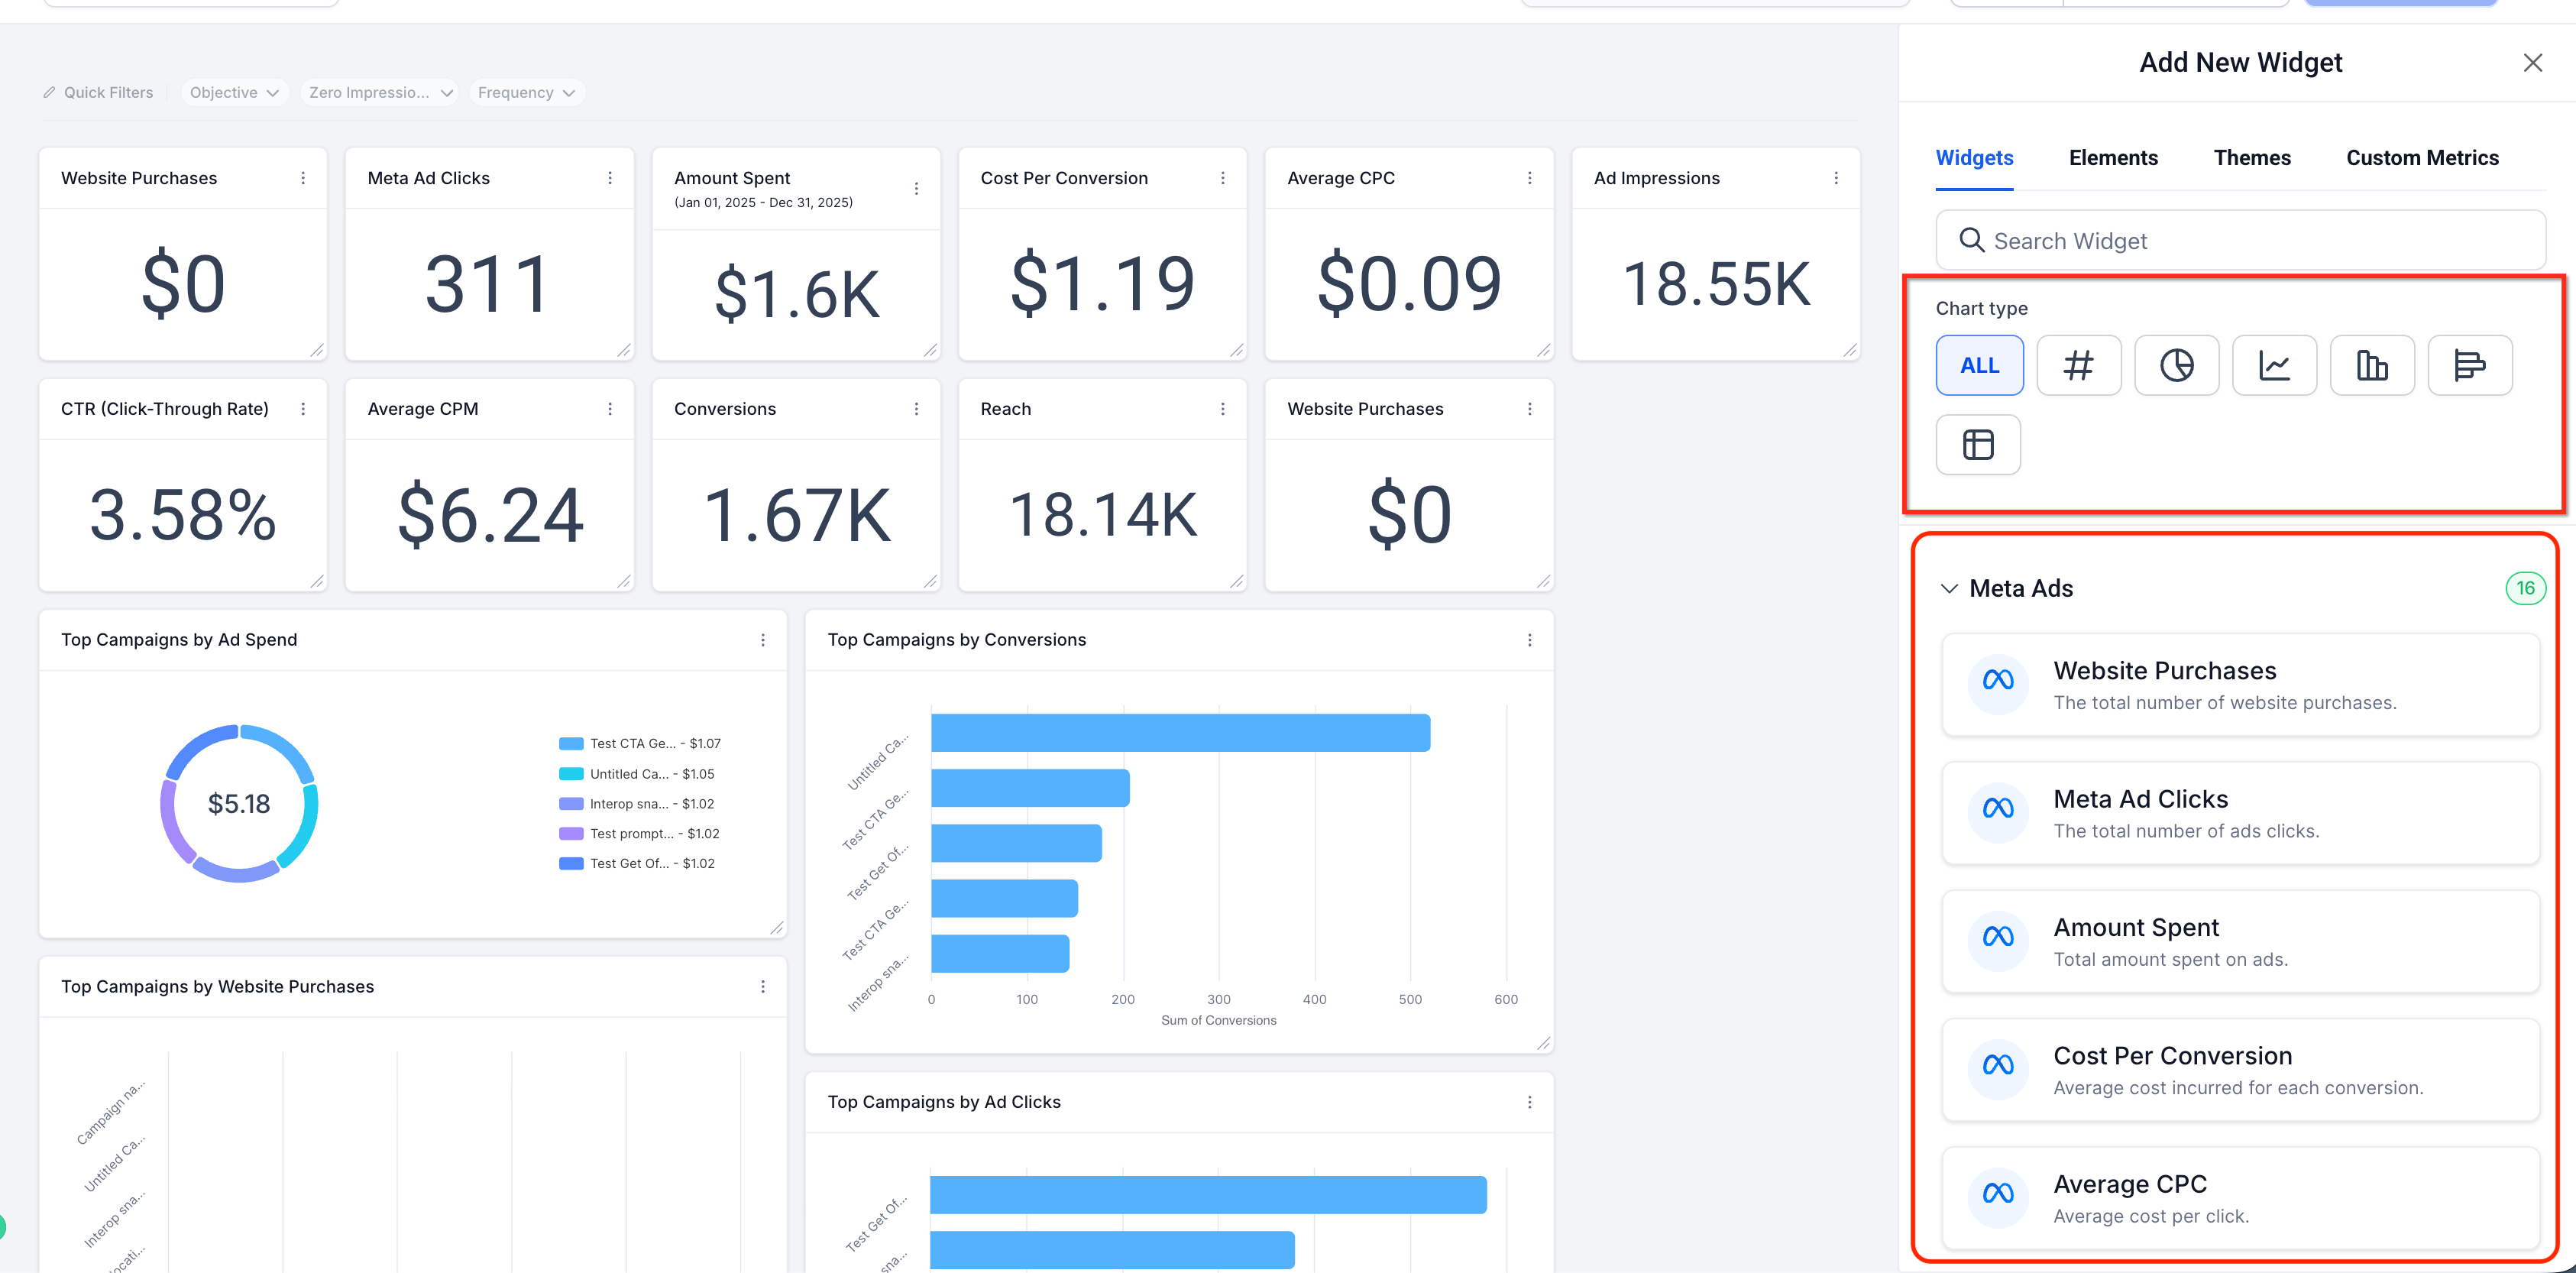
https://assets.patientcopilot.ai/0d6275022f81778b.gif) 3. Choose your preferred chart type (Numeric, Donut, Line, Bar, or Table), then scroll to the Meta Ads category and select your desired metric or Top Campaigns widget.!(
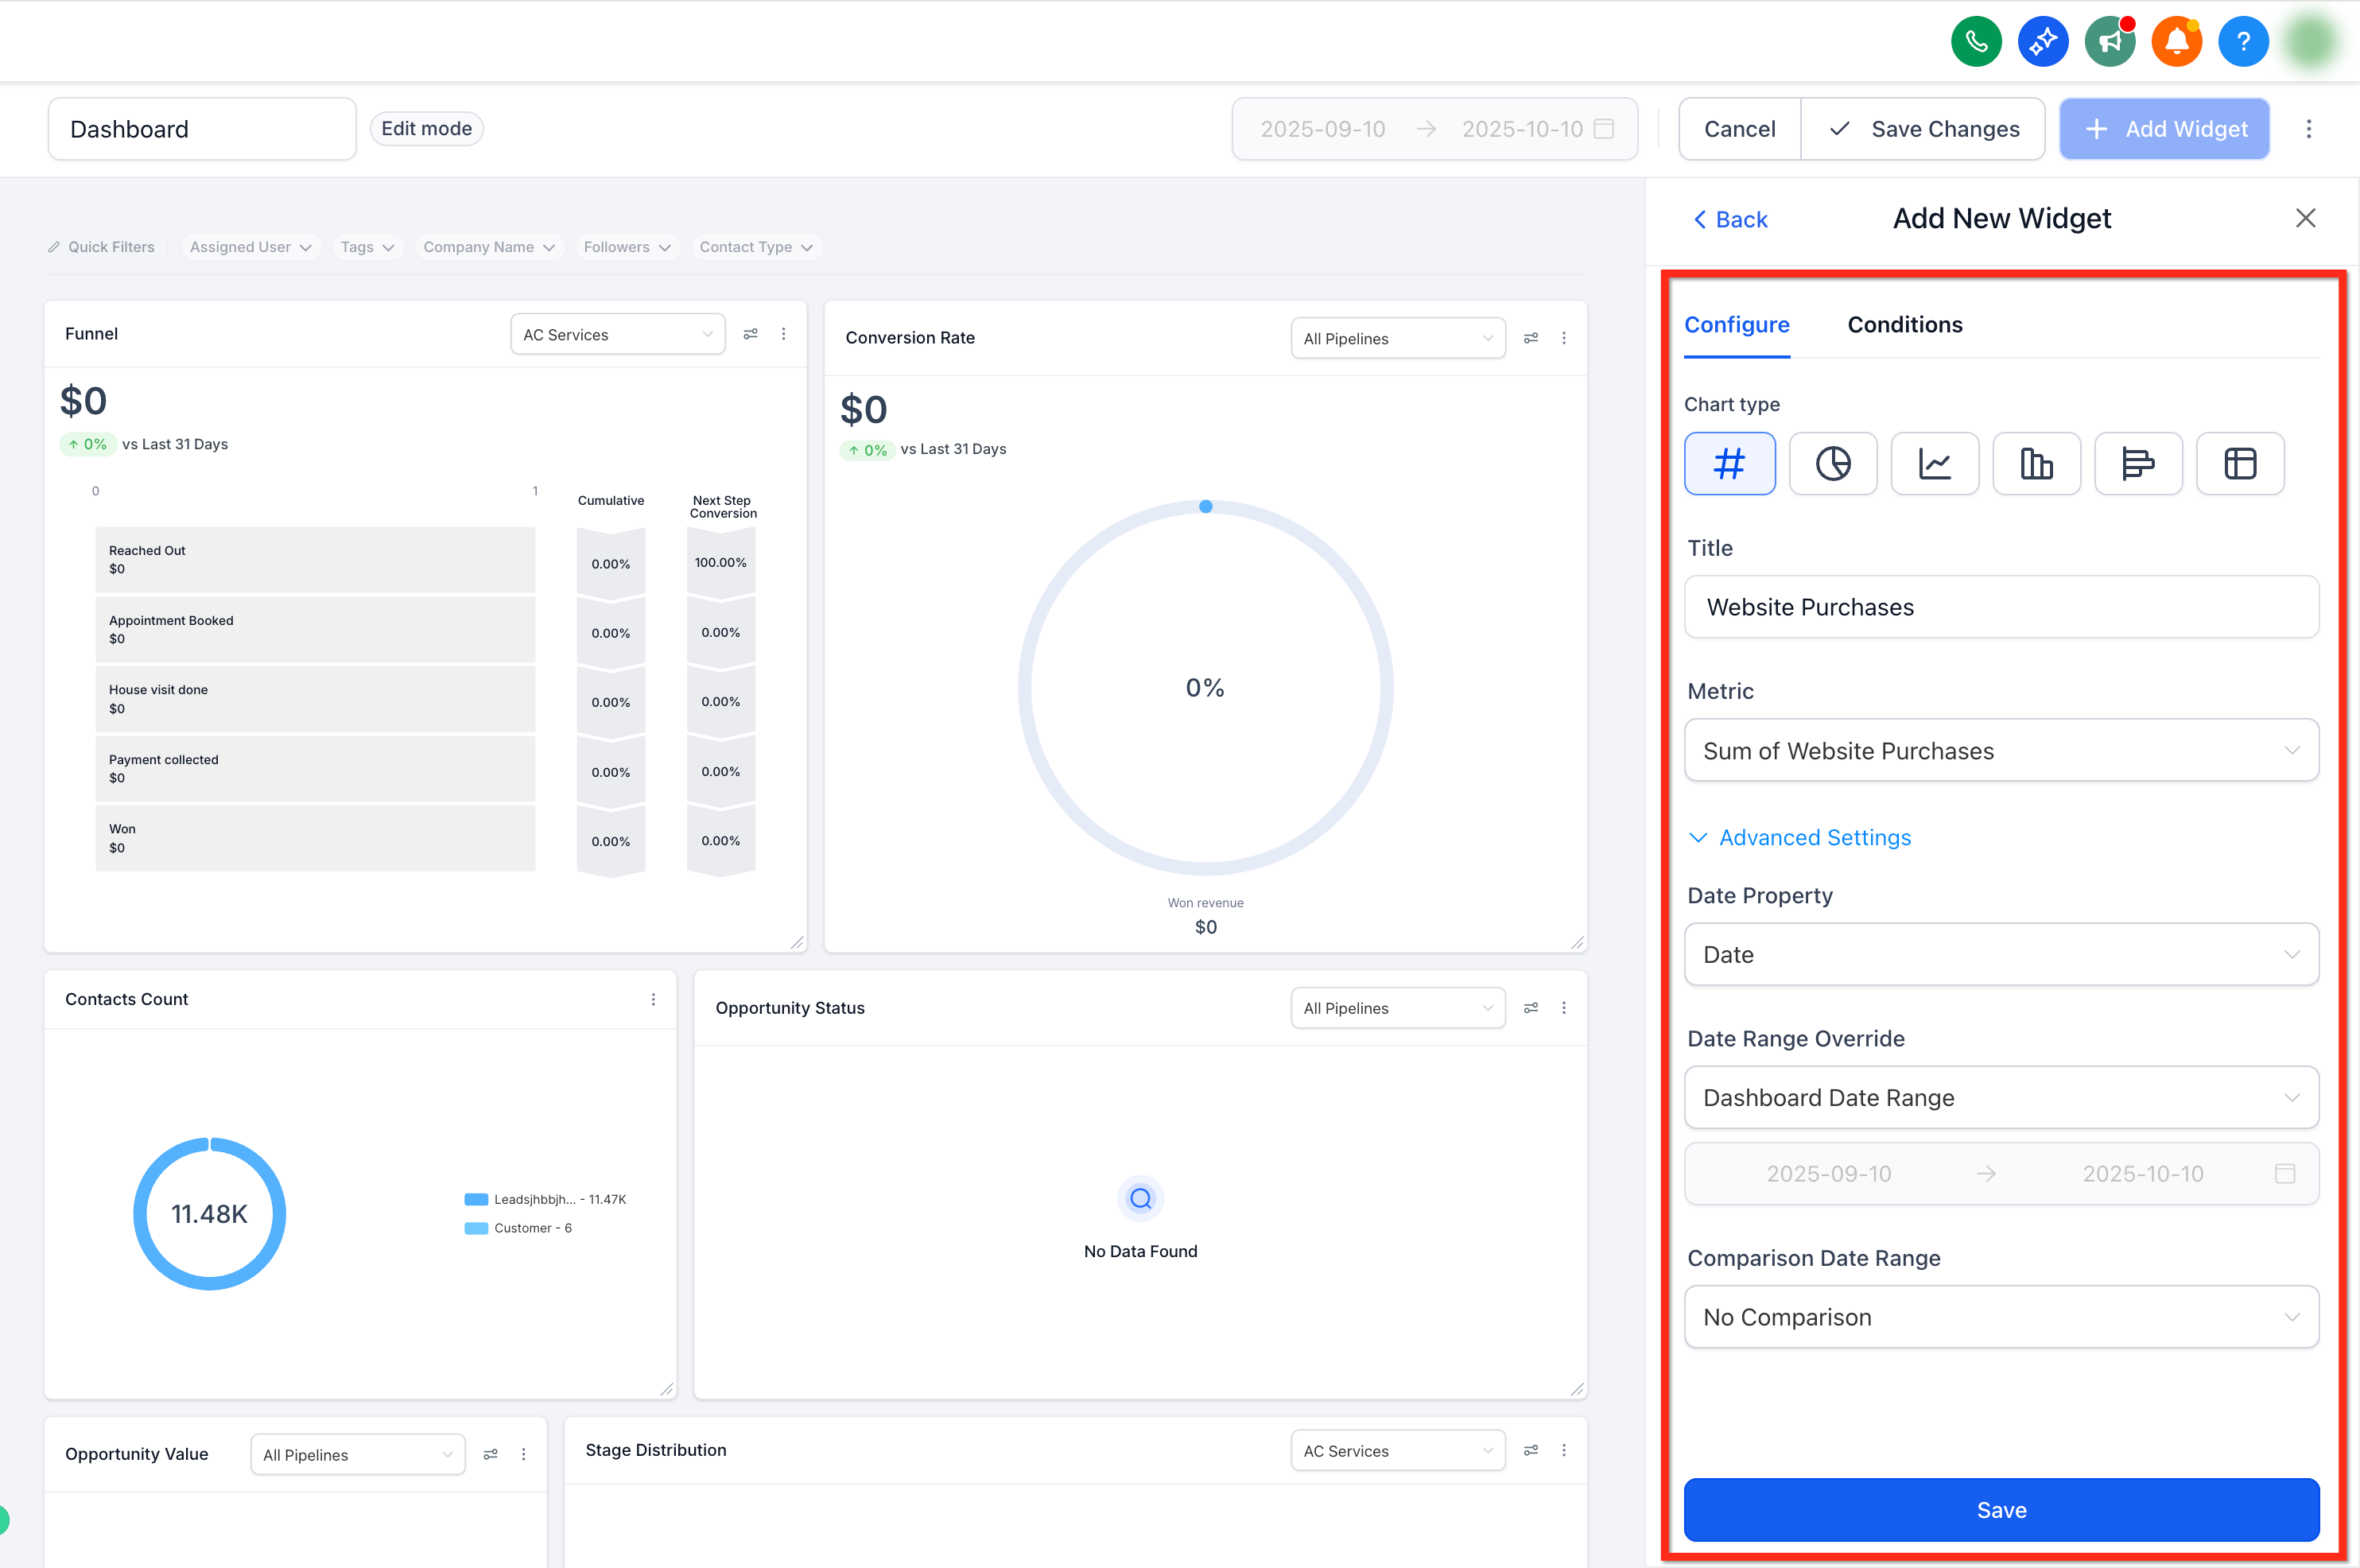
https://assets.patientcopilot.ai/447556dd988469d5.png) 4. Apply filters (campaign, metric, date range) or switch theme/colors.!(
https://assets.patientcopilot.ai/433d329393965b3f.png) 5. Click
Save. The widget begins streaming ad data. ###
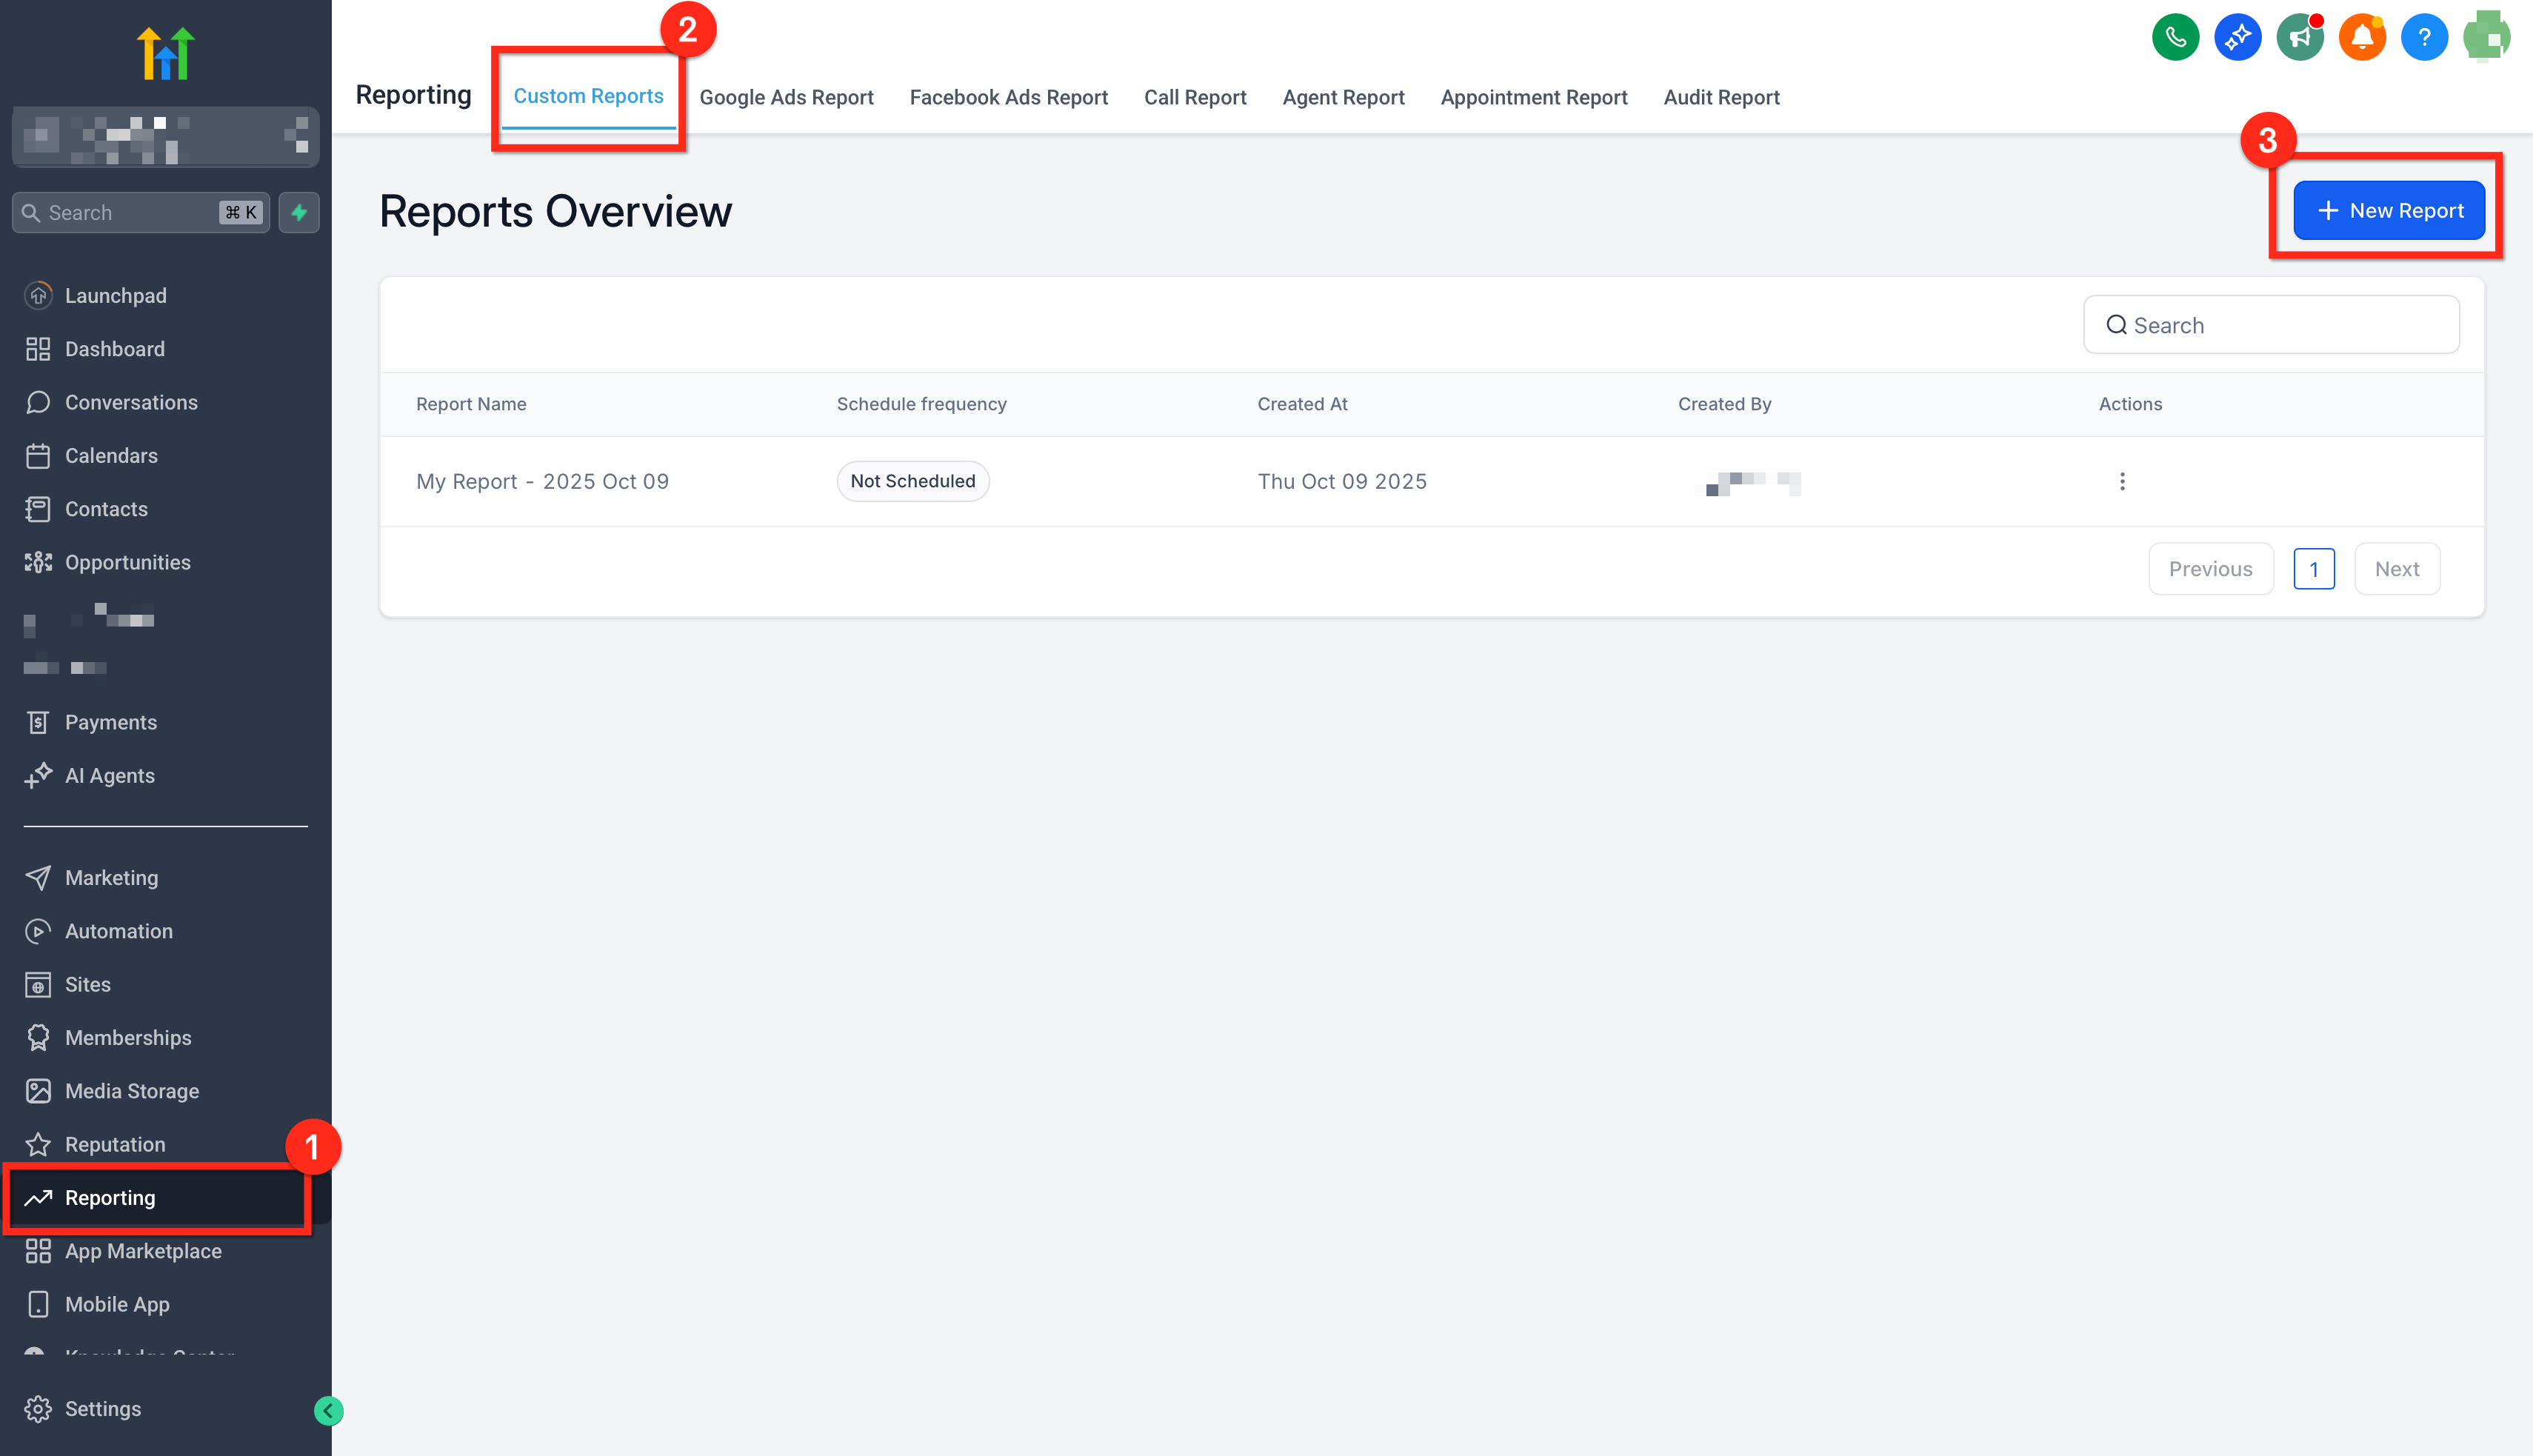
2) Add Widgets to a Custom Report 1. In your
Sub-Account, go to
Reporting → Custom Reports → open an existing report or click
New Report.!(
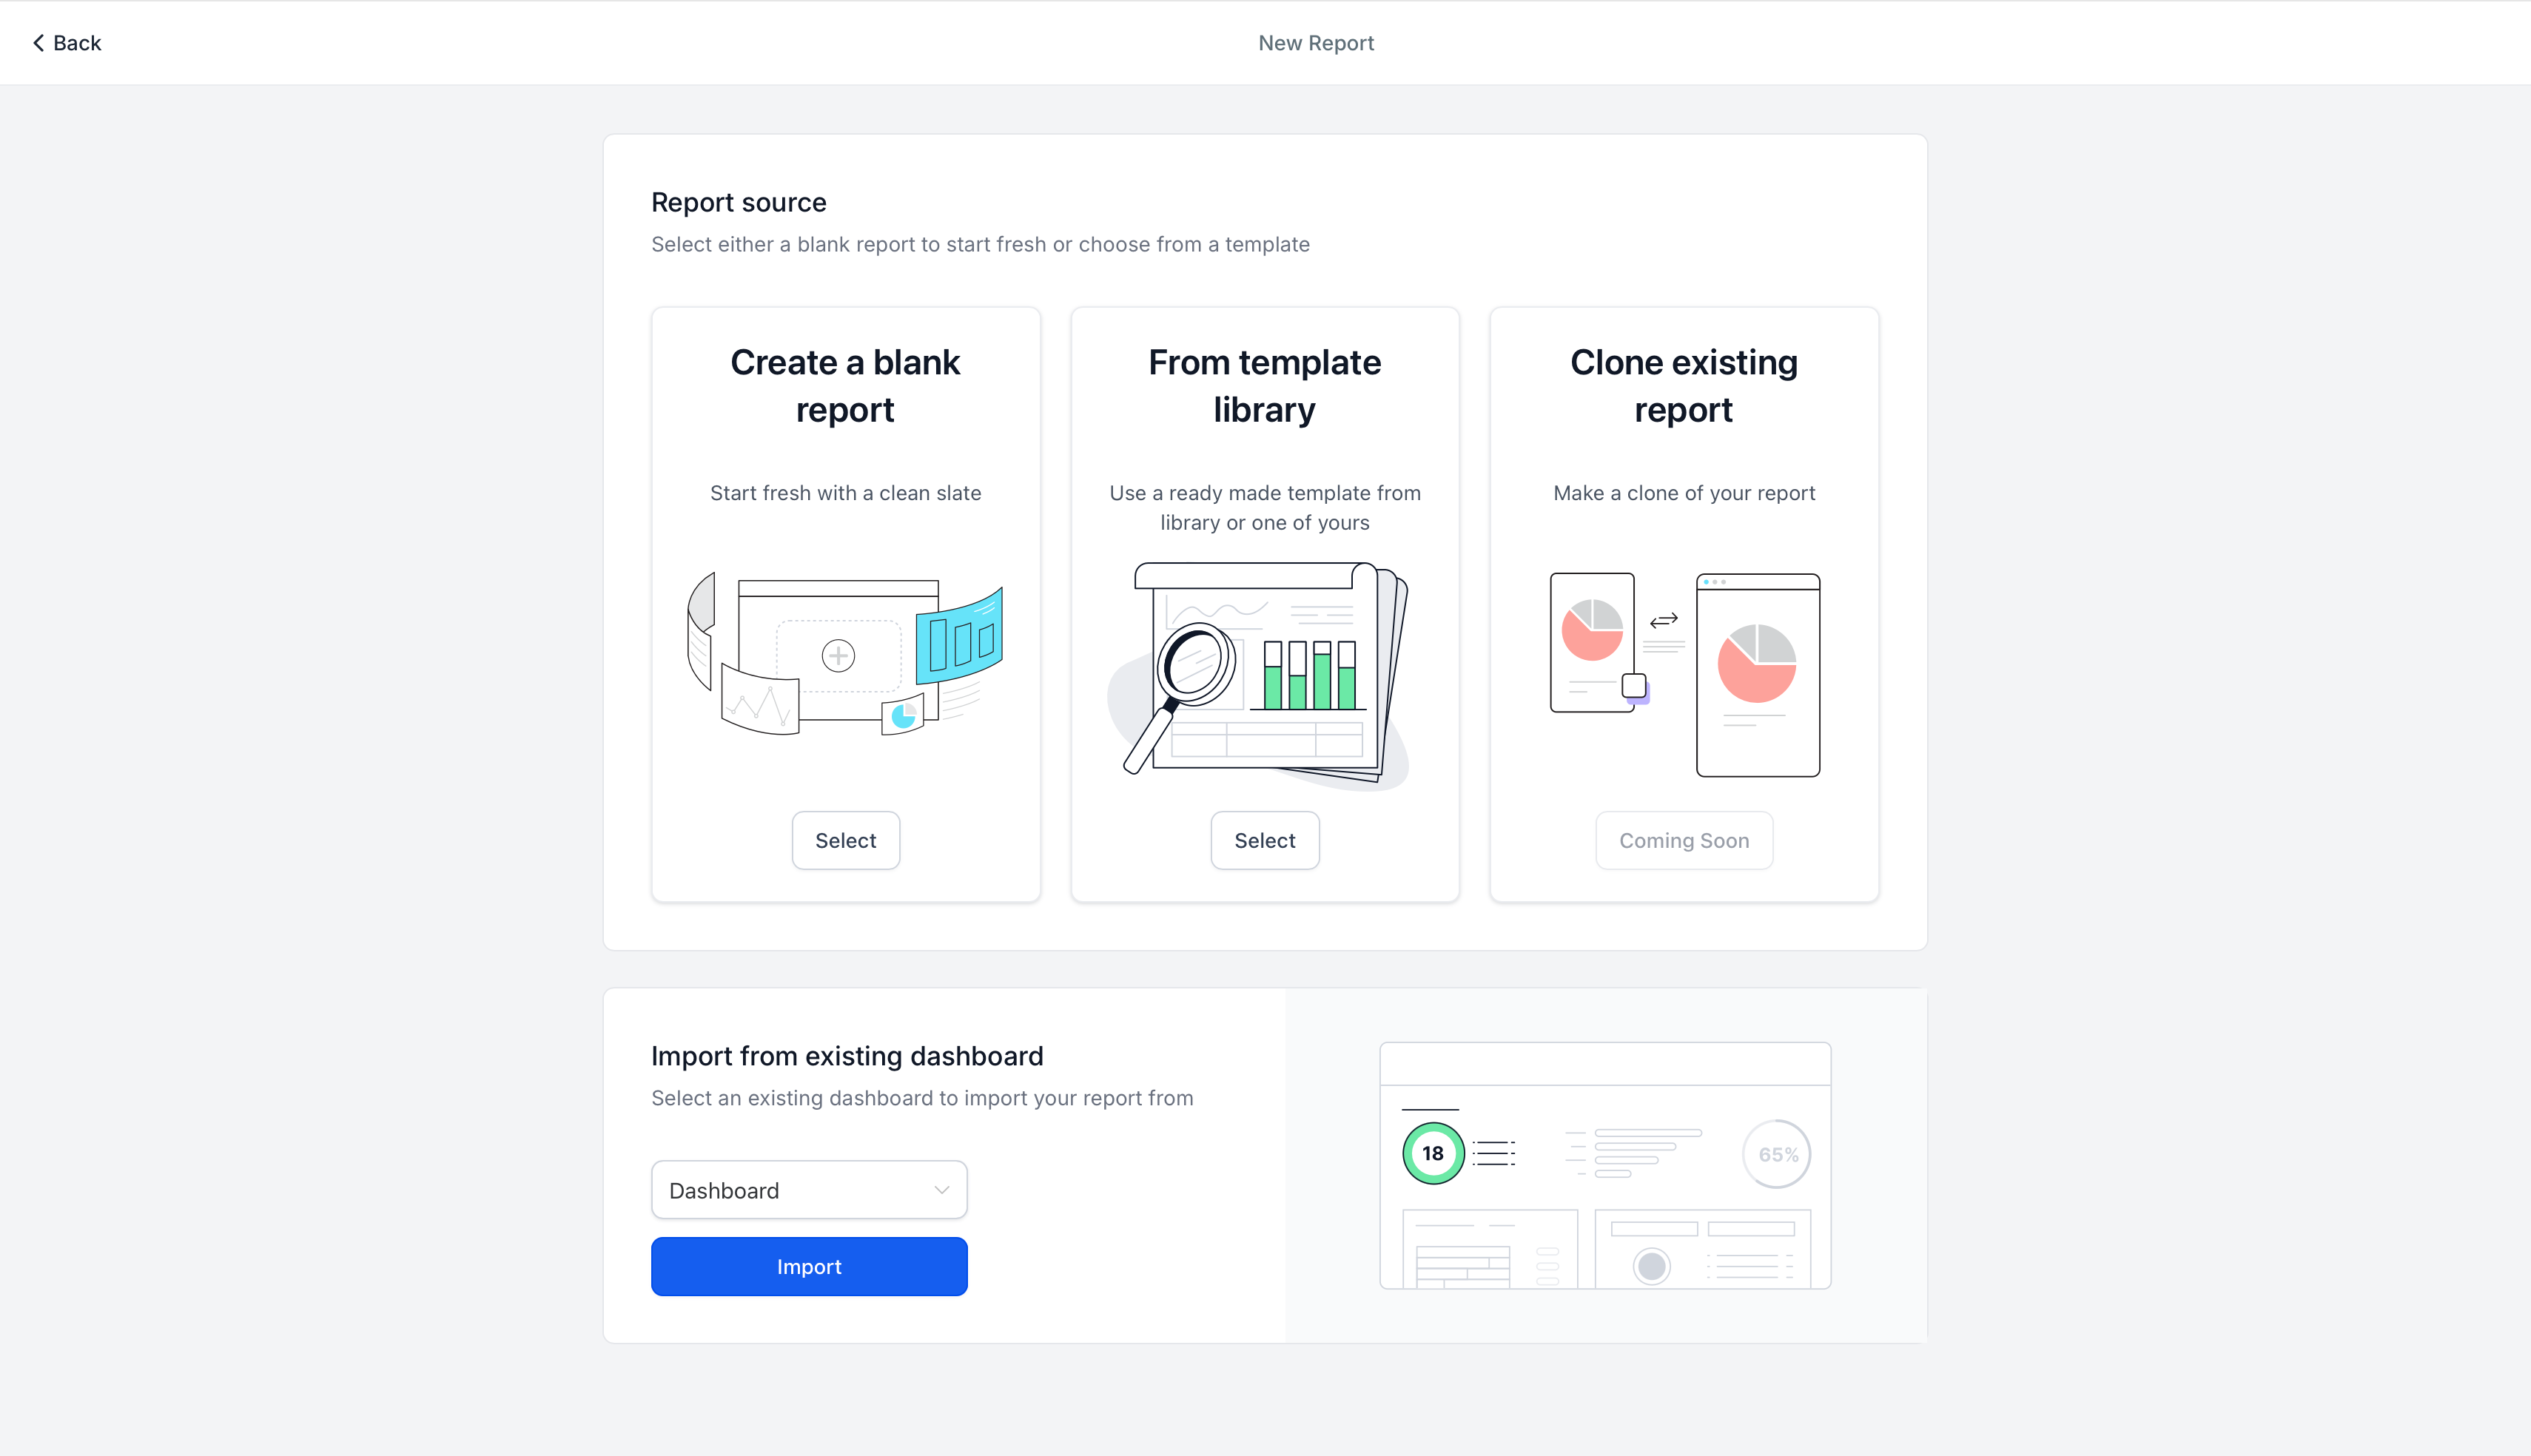
https://assets.patientcopilot.ai/19ae2b8fccdb830a.png) 2. Choose to
start from a blank canvas,
use a template, or
import an existing dashboard layout.!(
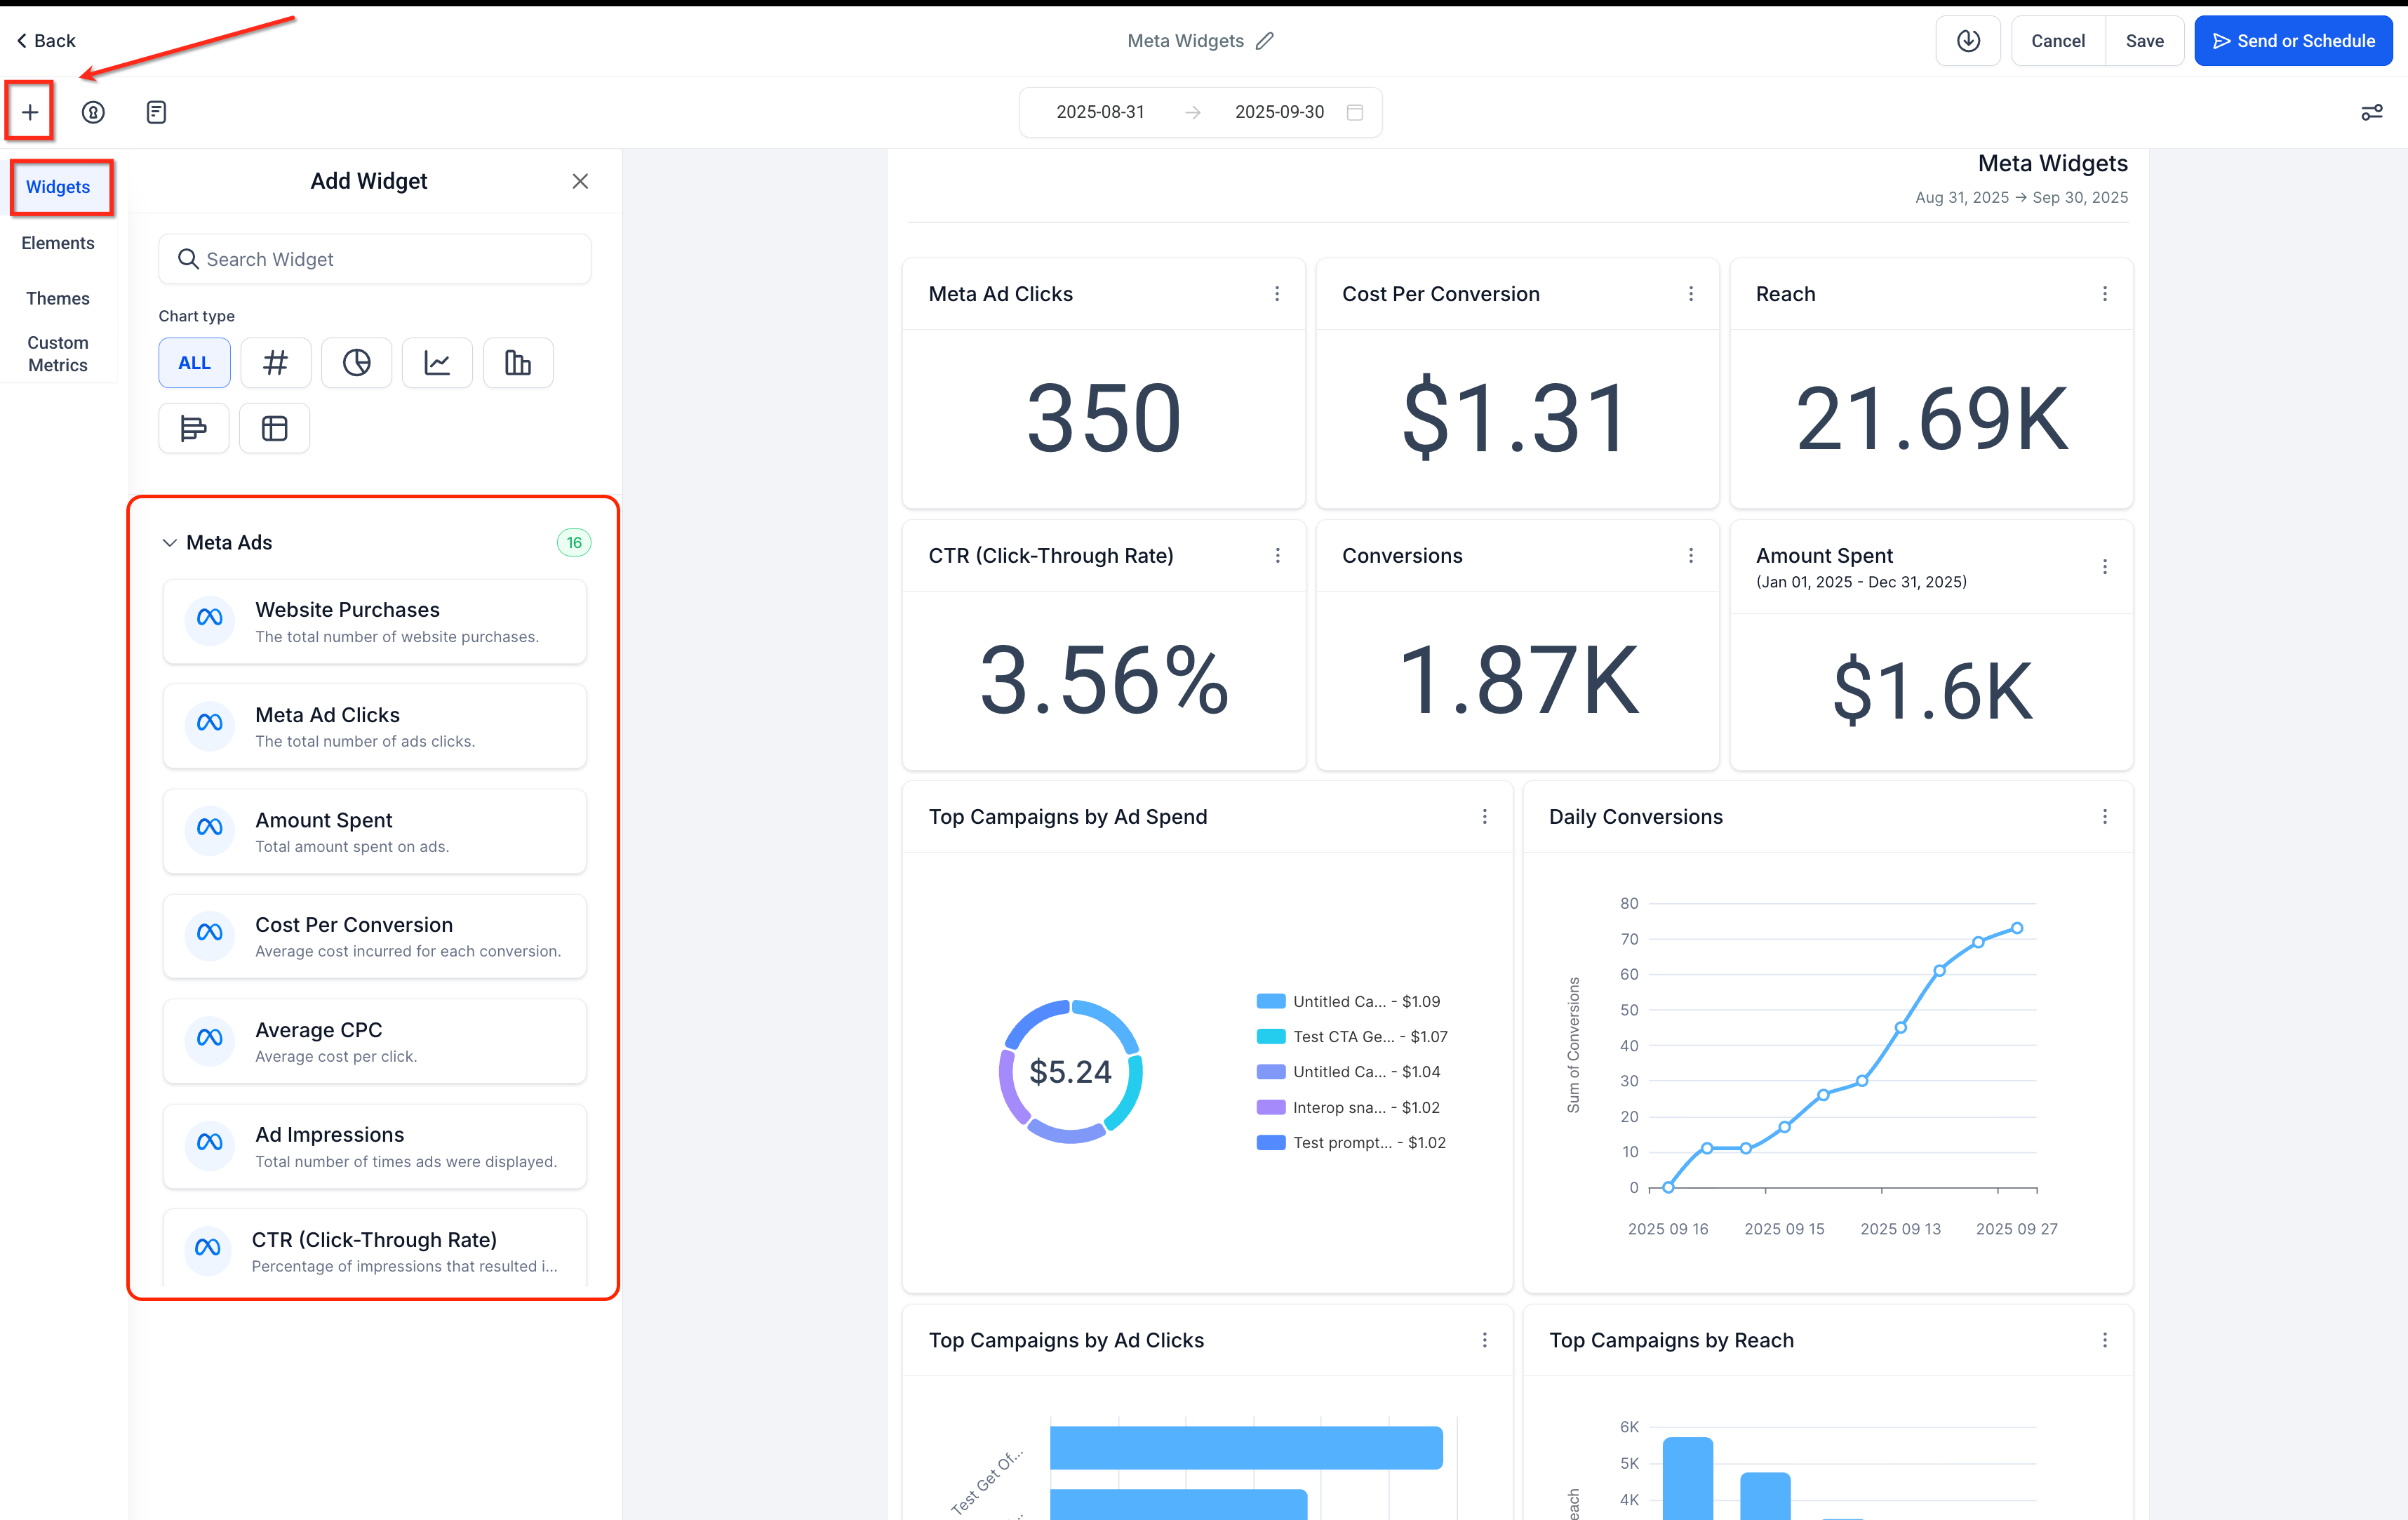
https://assets.patientcopilot.ai/ca143d717ef17d72.png) 3. Click
Add Widget/Element (top-left). In the widget list, find
Meta widgets and
drag the ones you want into the layout.!(
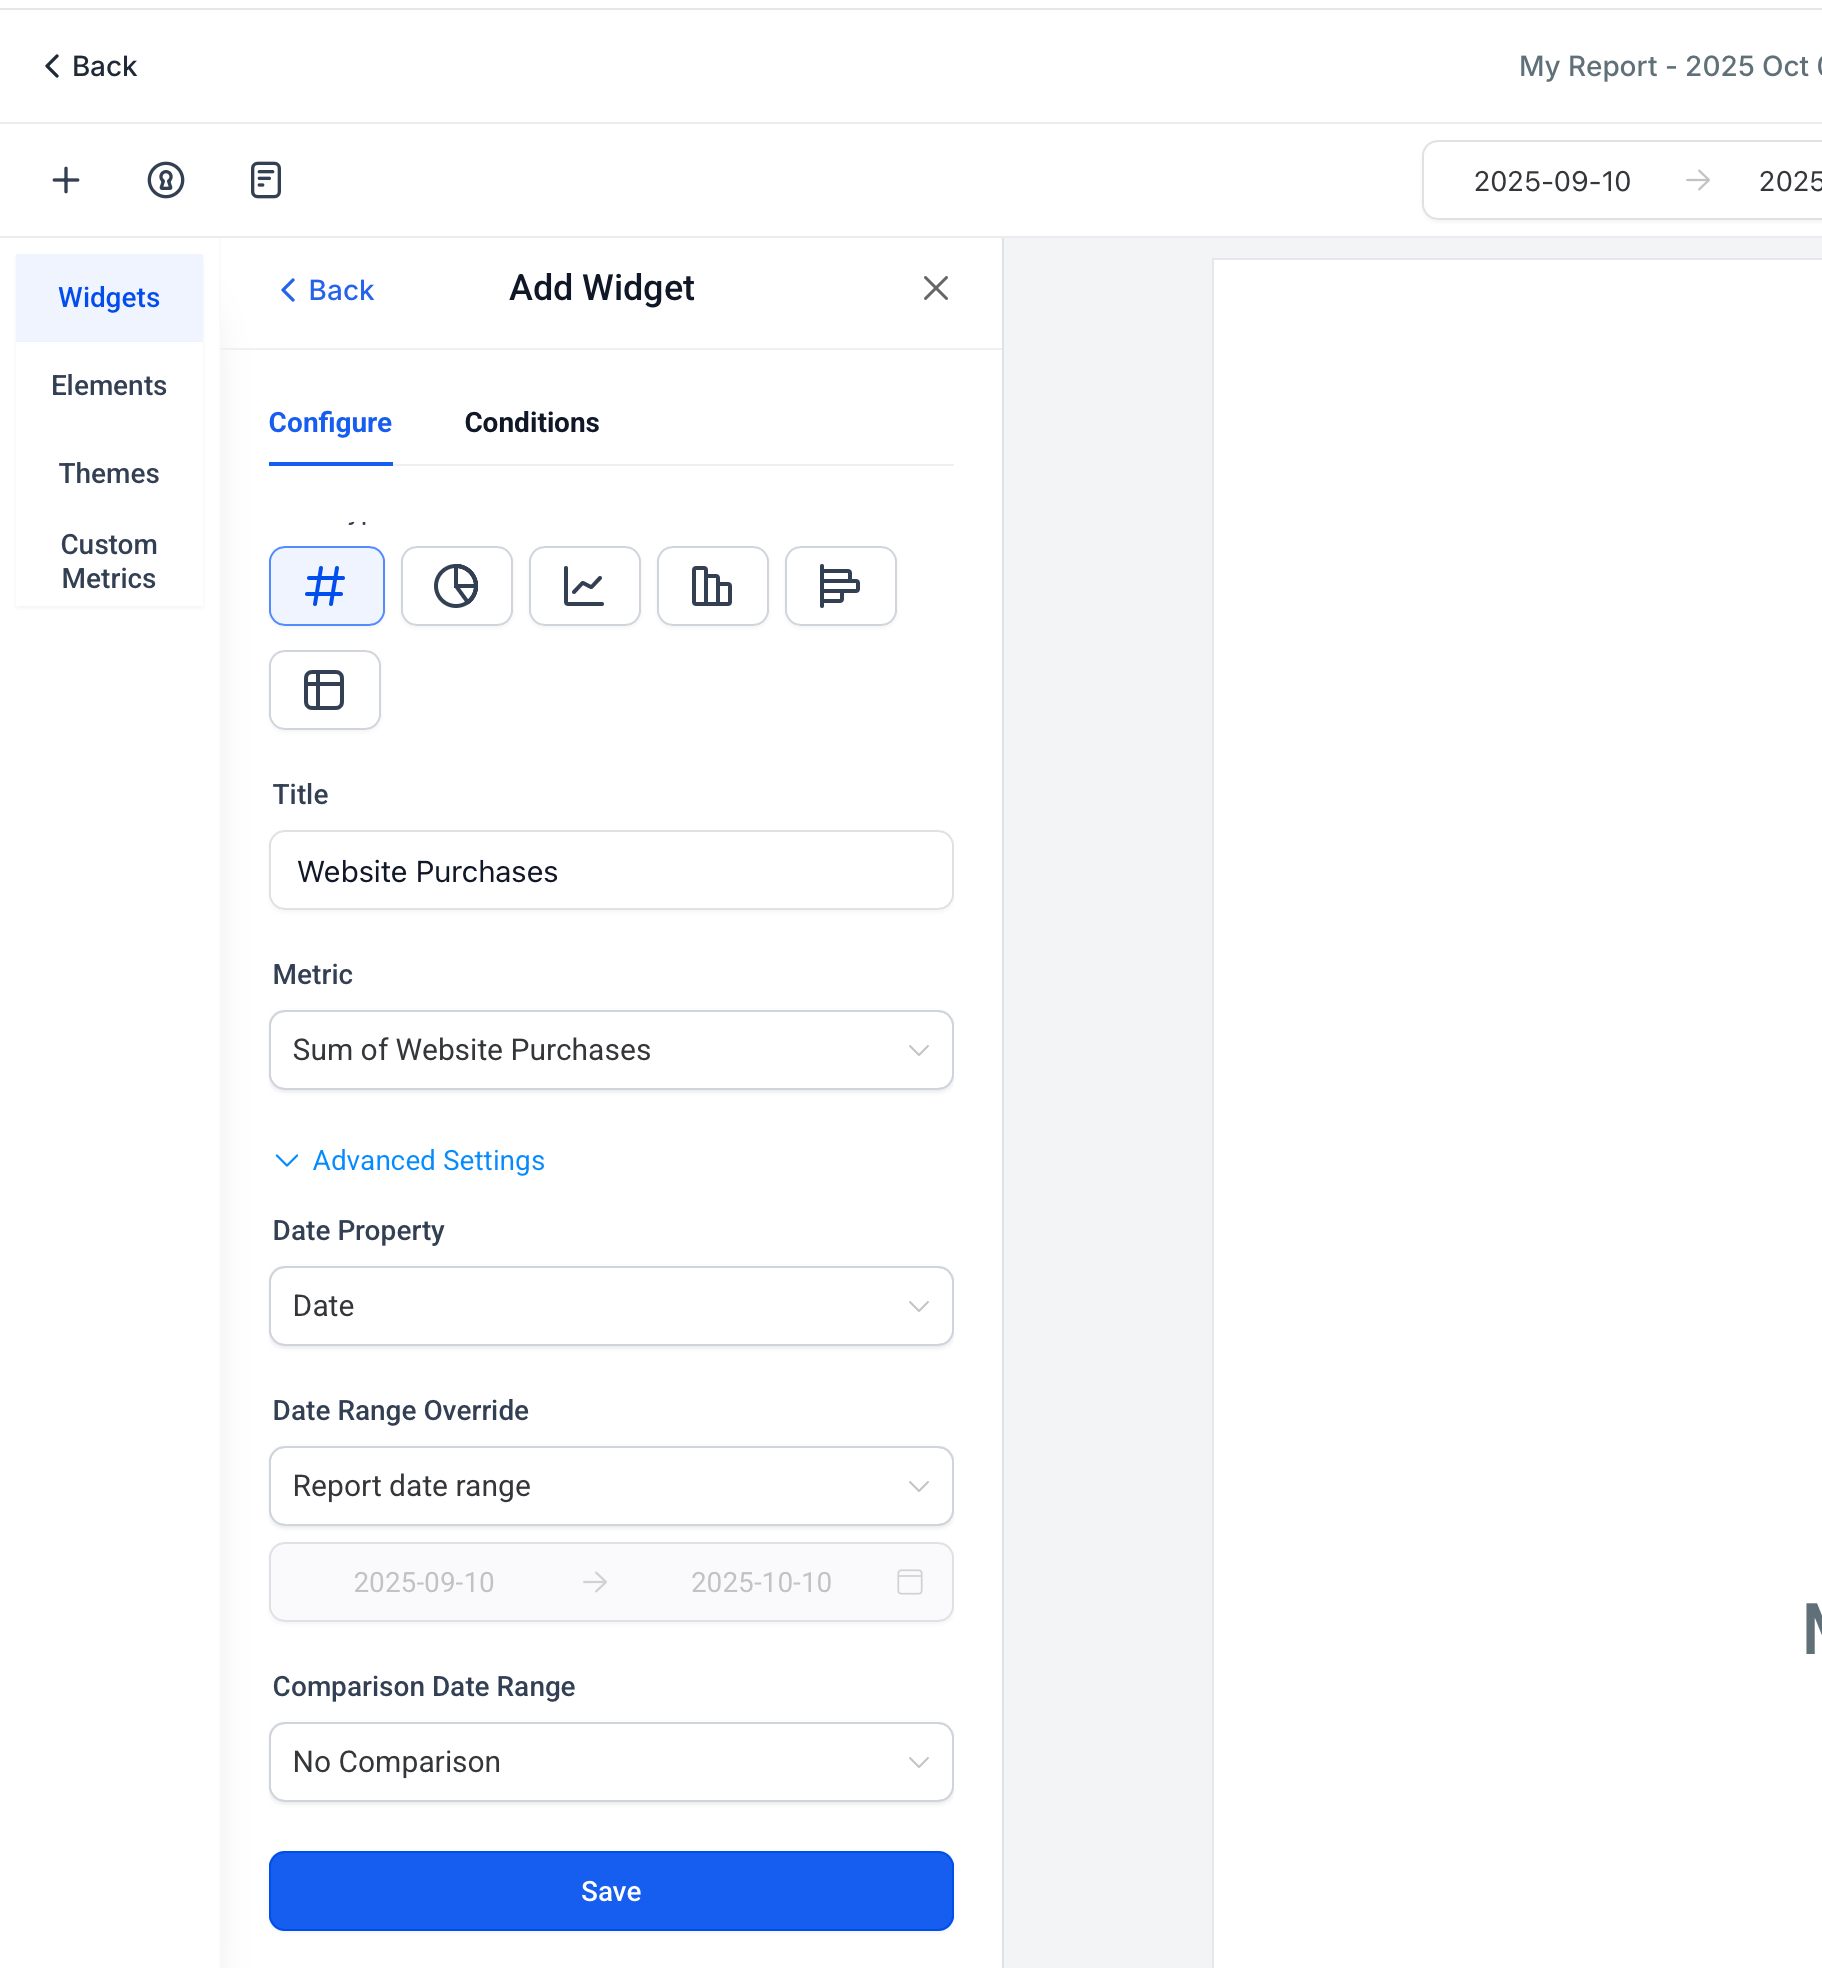
https://assets.patientcopilot.ai/7ea9fd5626d23795.png) 4. Configure each widget:
chart type,
filters, and
theme to suit your needs and Click
Save.!(
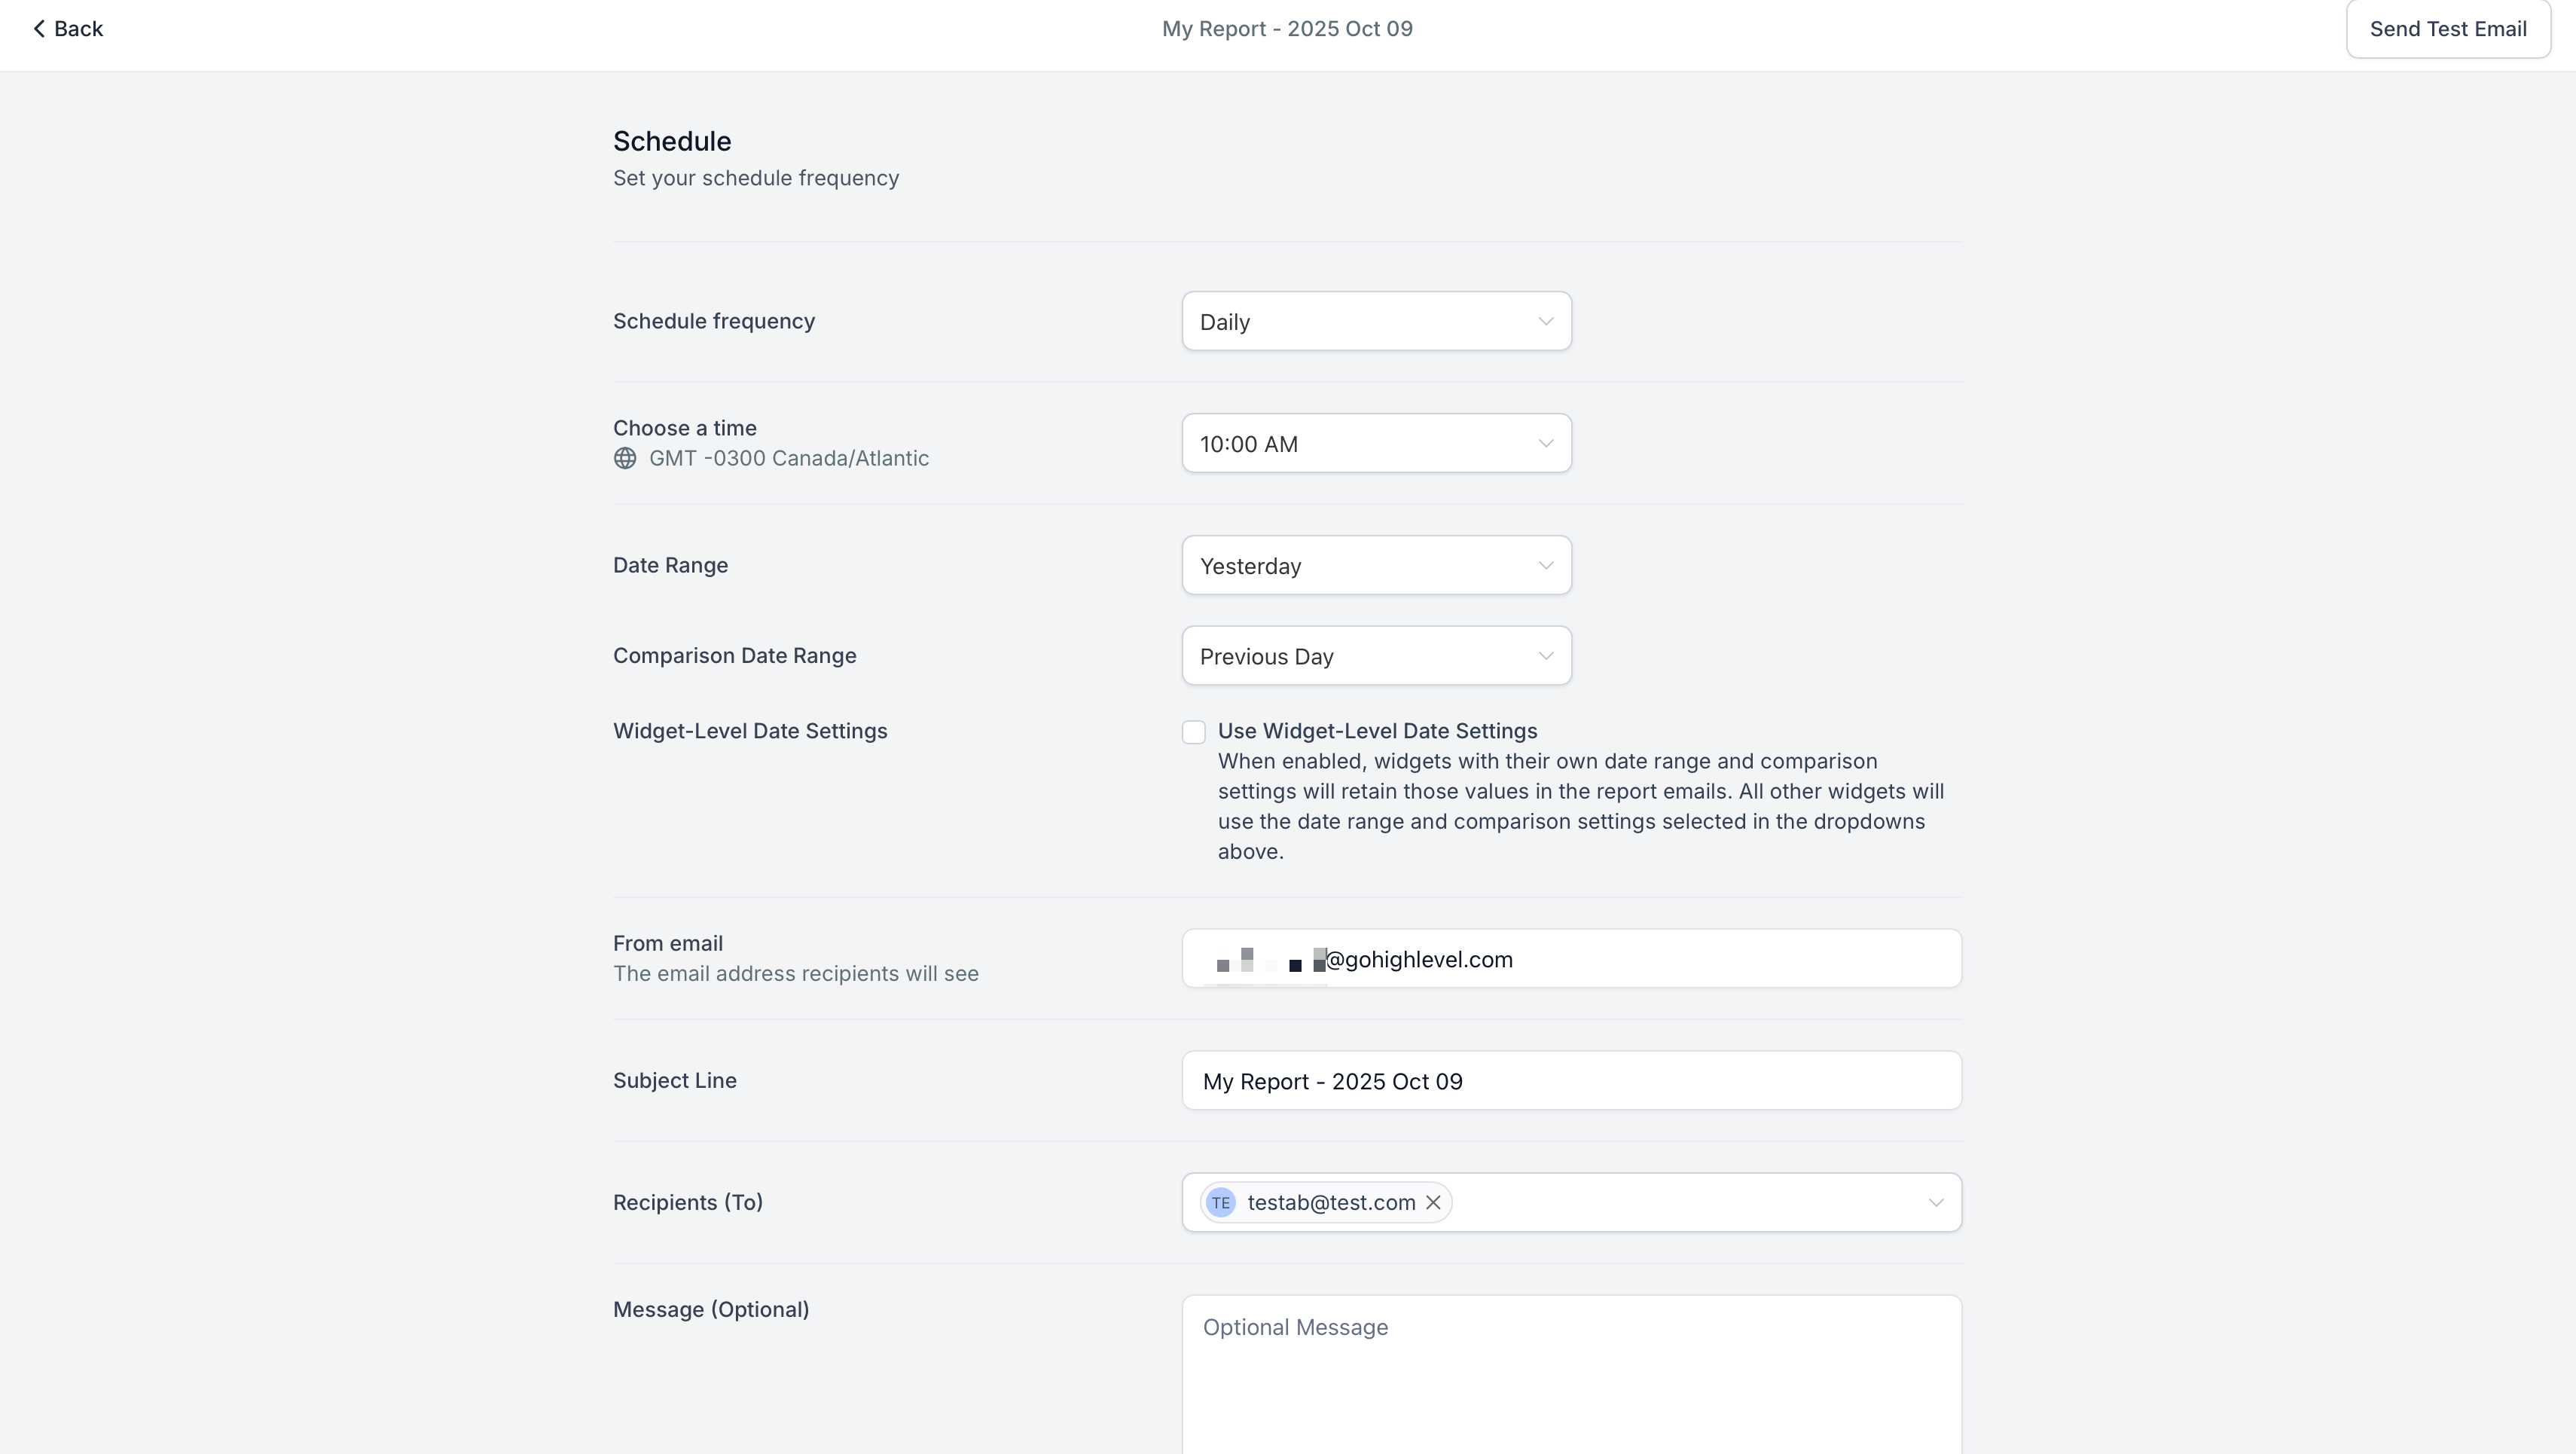
https://assets.patientcopilot.ai/0b014e34124c9c2a.png) 5. Click on Send or Schedule to set up an
email schedule to receive the report automatically.!(
https://assets.patientcopilot.ai/09a0bed72659561e.png) * * * ##
Frequently Asked Questions Q. Do I need a separate Meta connection for every sub‑account? Yes. Each sub‑account dashboard pulls data only from the Meta ad account connected inside that sub‑account.
Q. How often do Meta Ad Widgets refresh? Widgets
update automatically; no manual refresh is required.
Q. Why is my widget blank after I add it? Common causes include an overly narrow date range, restrictive campaign filters, no eligible ad account selected, or missing LeadConnector permissions. Remove filters, widen the range, and verify the connection.
Q. Which roles can connect Meta and add widgets? Users need permission to manage
Ad Manager connections and to
Edit dashboards or
Create reports. View‑only users can see shared dashboards but can’t modify them.
Q. Can I combine Google Ads and Meta Ads metrics on the same dashboard? Yes. Add widgets from both libraries to compare channels side by side.
Q. Can I schedule a Meta‑only report for clients? Yes. Build a report using only Meta widgets, then schedule email delivery. Confirm export and layout options meet the client’s needs.
Q. Will disabling the Meta integration break my existing widgets? Widgets stop displaying data until you reconnect an eligible ad account, but your layout and widget settings remain in place. * * * ##
Related Articles -
How to Create and Use Custom Metrics For Dashboard Reports 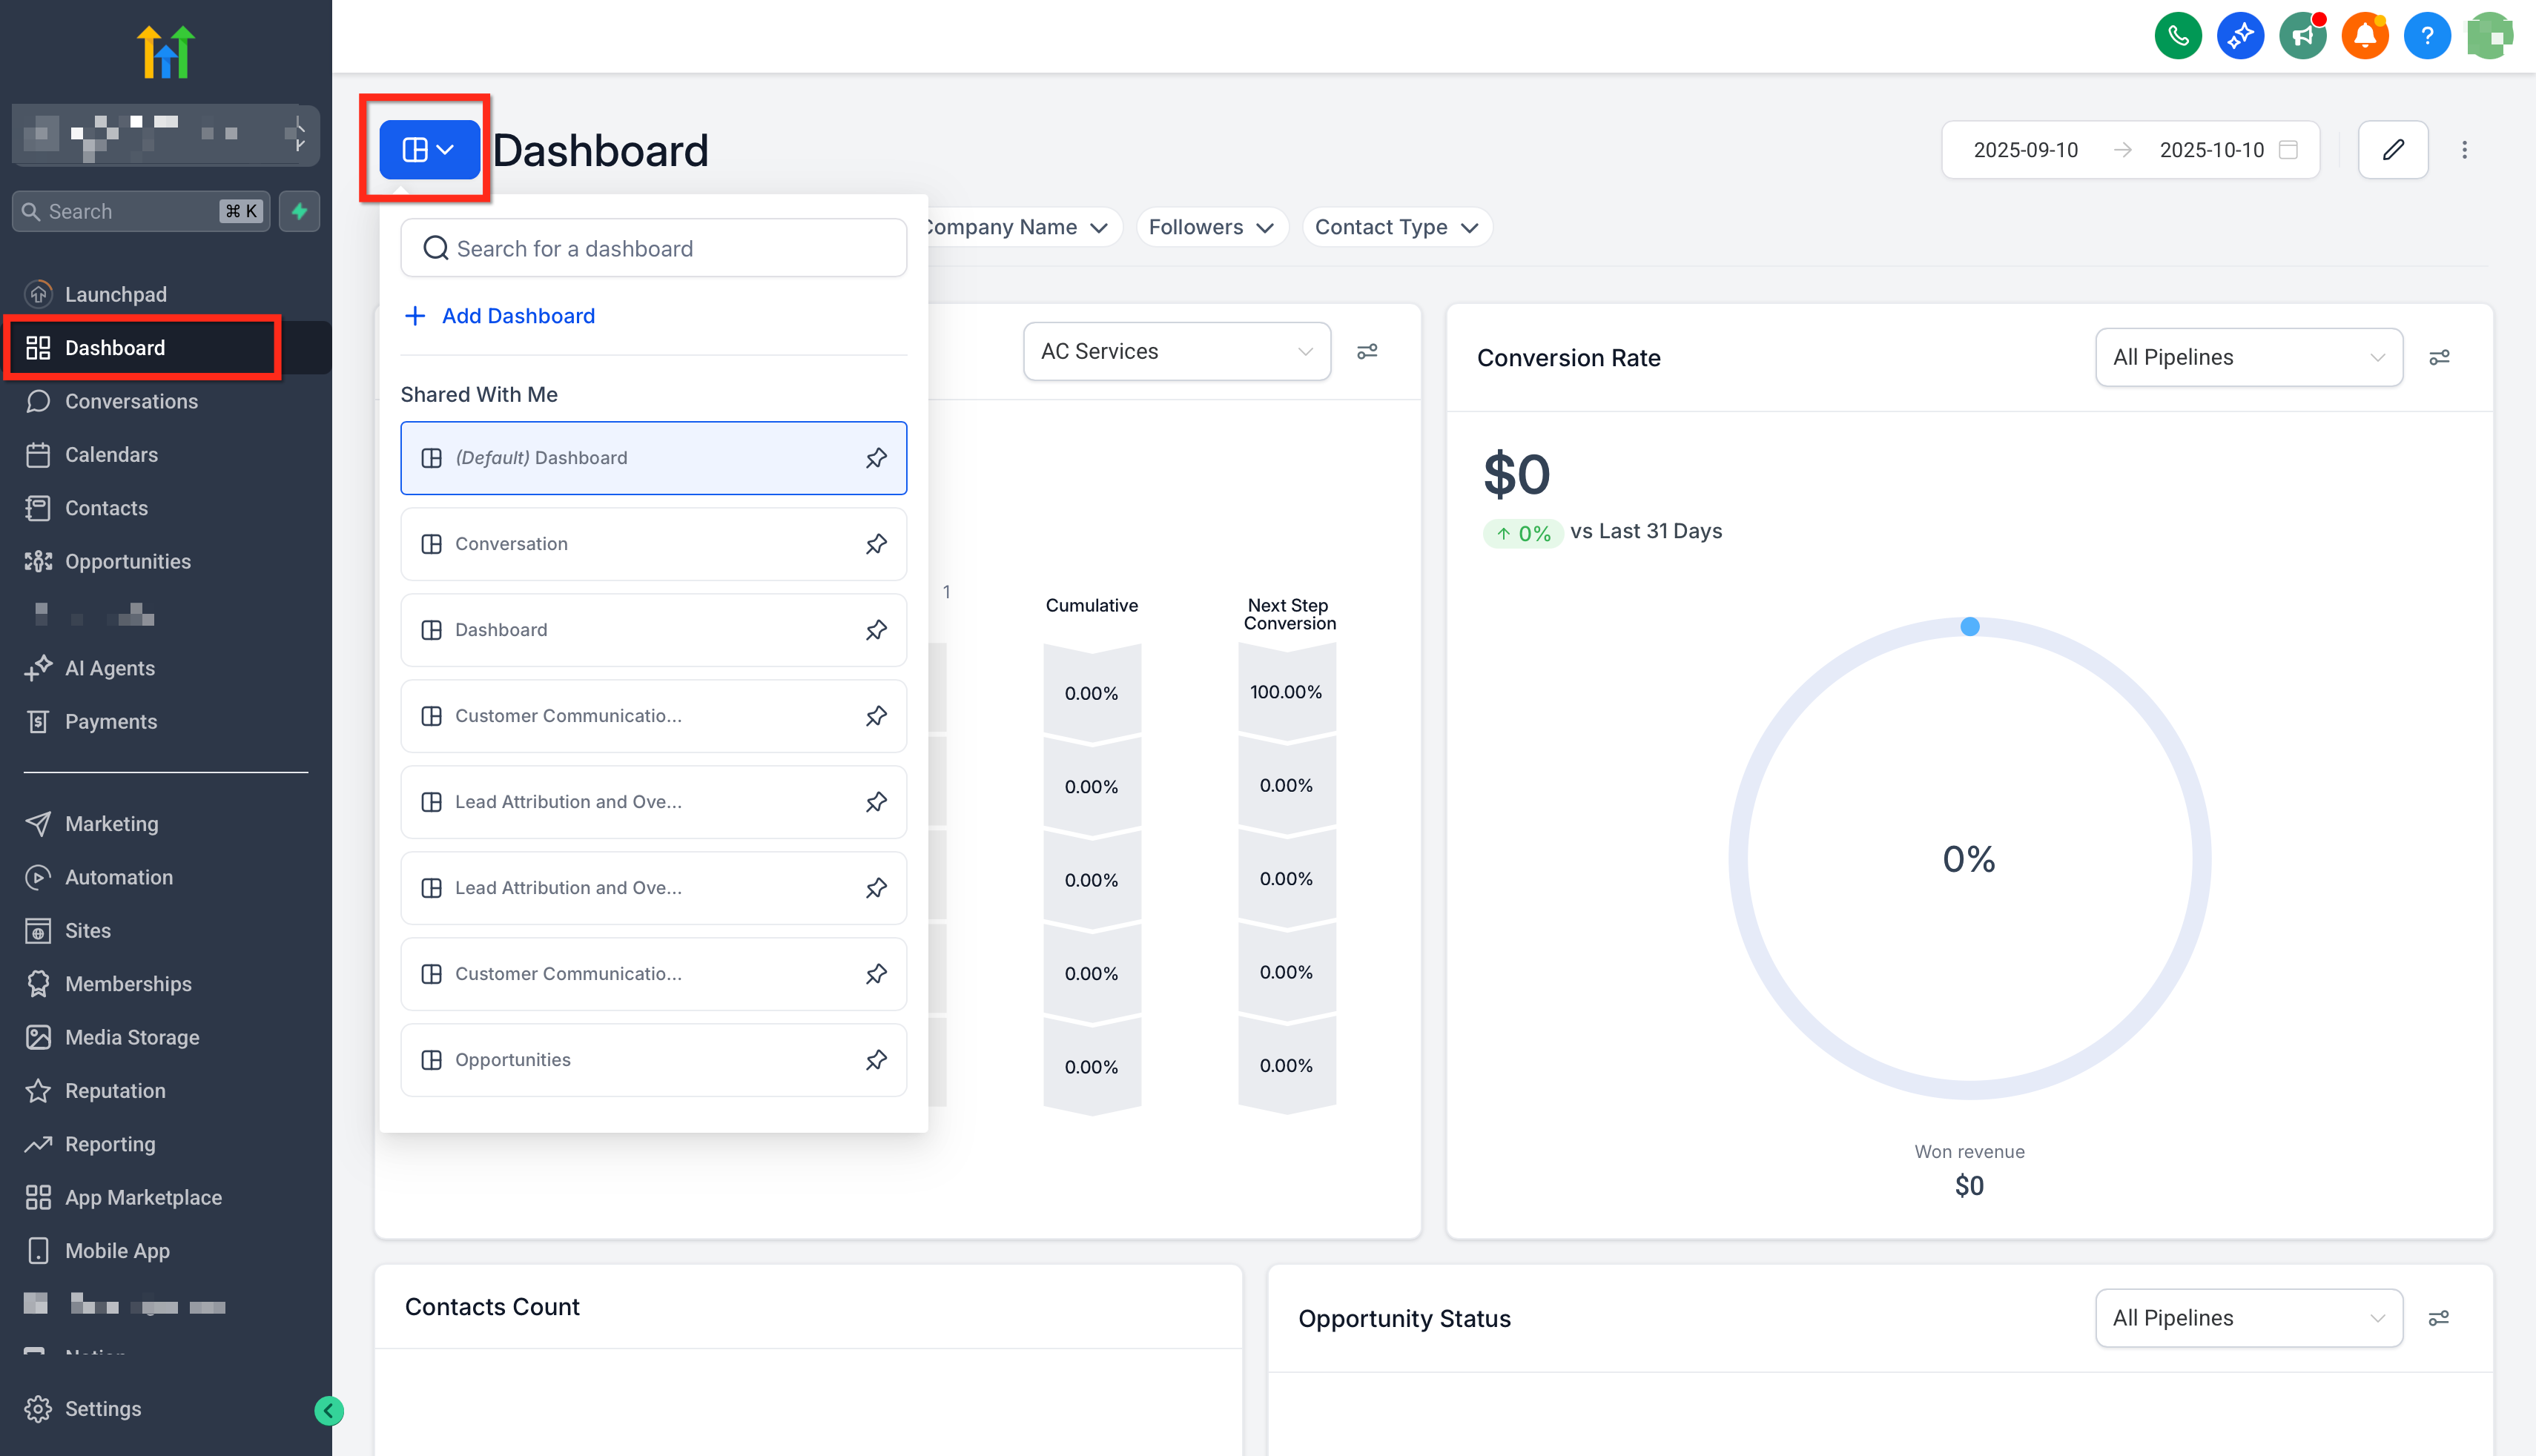