Agency Dashboard: Summary Tab
Learn how the Agency Dashboard Summary tab calculates Revenue and MRR using only Patient Copilot-backed sources and how that affects the Summary tab’s KPI cards and charts. The Agency Dashboard Summary tab shows Revenue and MRR using refined calculations that include only Patient Copilot-backed revenue sources. This improves accuracy and consistency across Summary metrics. Navigate to Patient Copilot > Agency > Agency Dashboard. The Summary tab includes Revenue and MRR from these sources: - SaaS
- Reselling
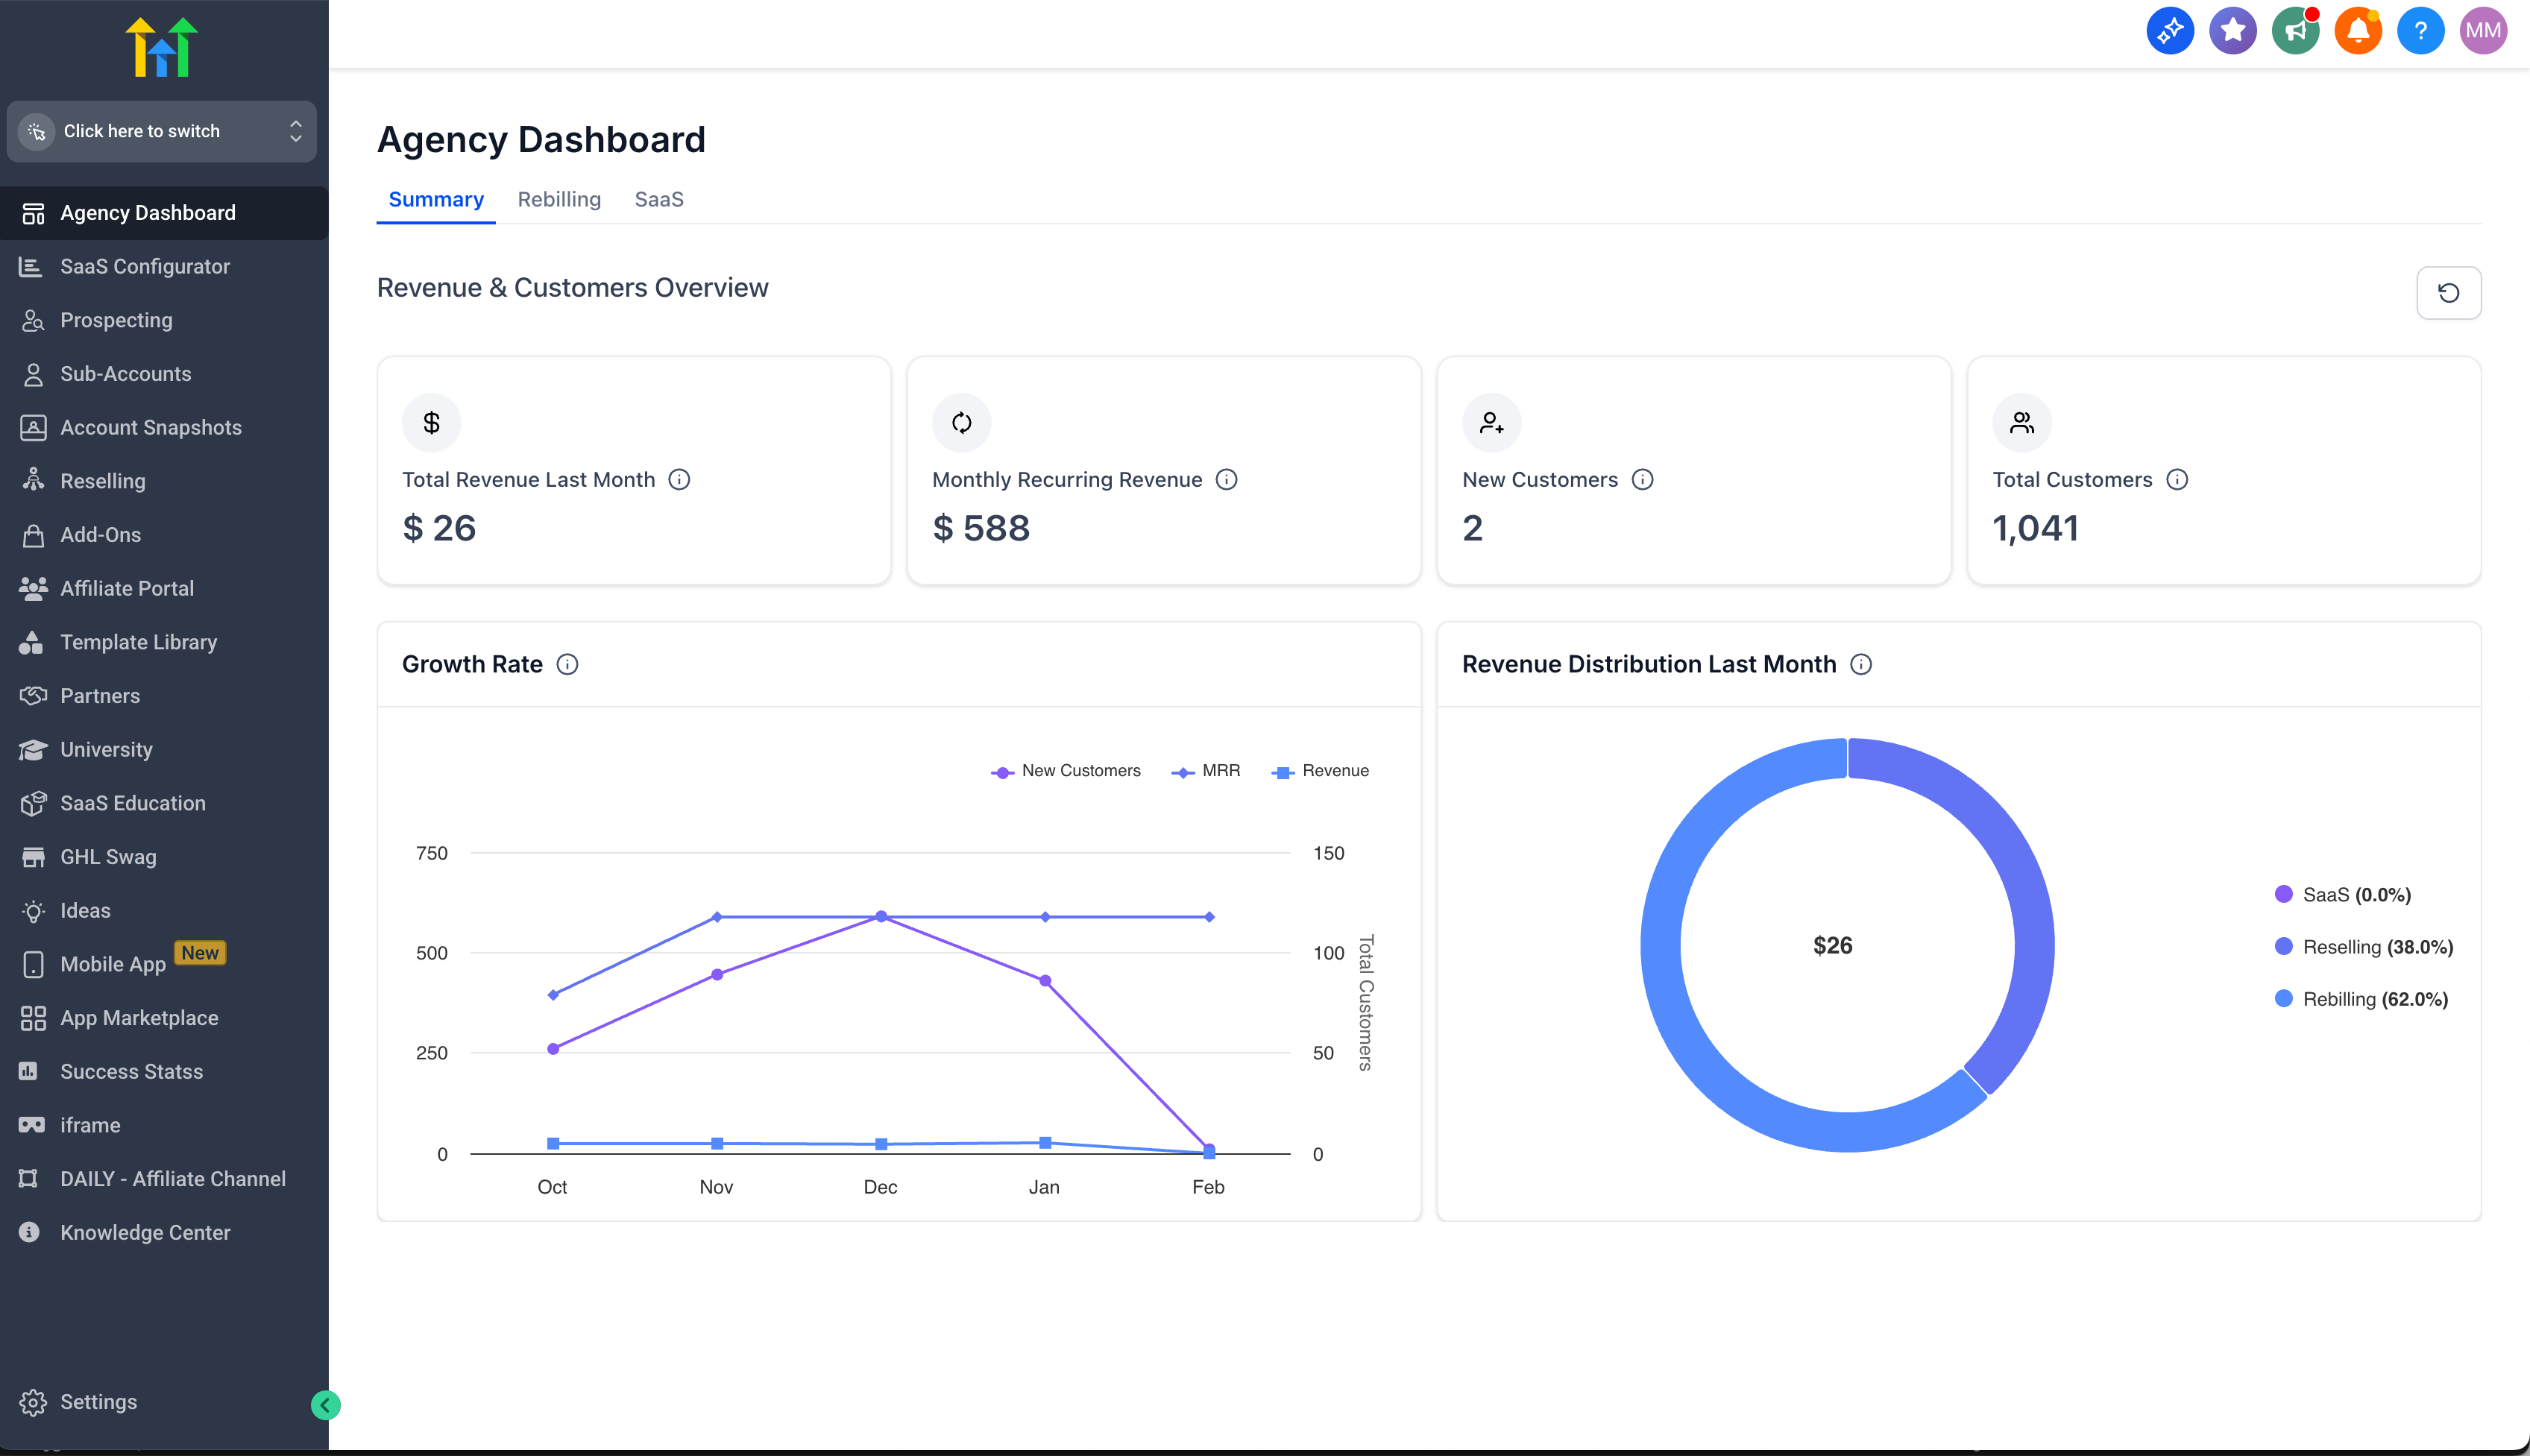
- Rebilling Note: Values may differ from older views because Patient Copilot now filters out external or non-qualifying sources.!(https://assets.patientcopilot.ai/f6cdffa685a1a903.png) KPI cards These cards now reflect only qualifying Patient Copilot-backed revenue: - Total Revenue (Last Month)
- Monthly Recurring Revenue (MRR)
- New Customers
- Total Customers Growth Rate chart The Growth Rate chart aligns with the updated Revenue and MRR calculations. Revenue Distribution (Last Month) The Revenue Distribution (Last Month) chart breaks down last month’s revenue by: - SaaS
- Reselling
- Rebilling * * * **Frequently Asked Questions ** Q Why do my Revenue or MRR numbers look different than before? A The Summary tab now includes only Patient Copilot-backed sources (SaaS, Reselling, Rebilling). This removes external noise and improves consistency across Summary metrics. Was this article helpful? That’s Great! Thank you for your feedback Sorry! We couldn’t be helpful Thank you for your feedback Feedback sent We appreciate your effort and will try to fix the article