Agency Dashboard for Rebilling
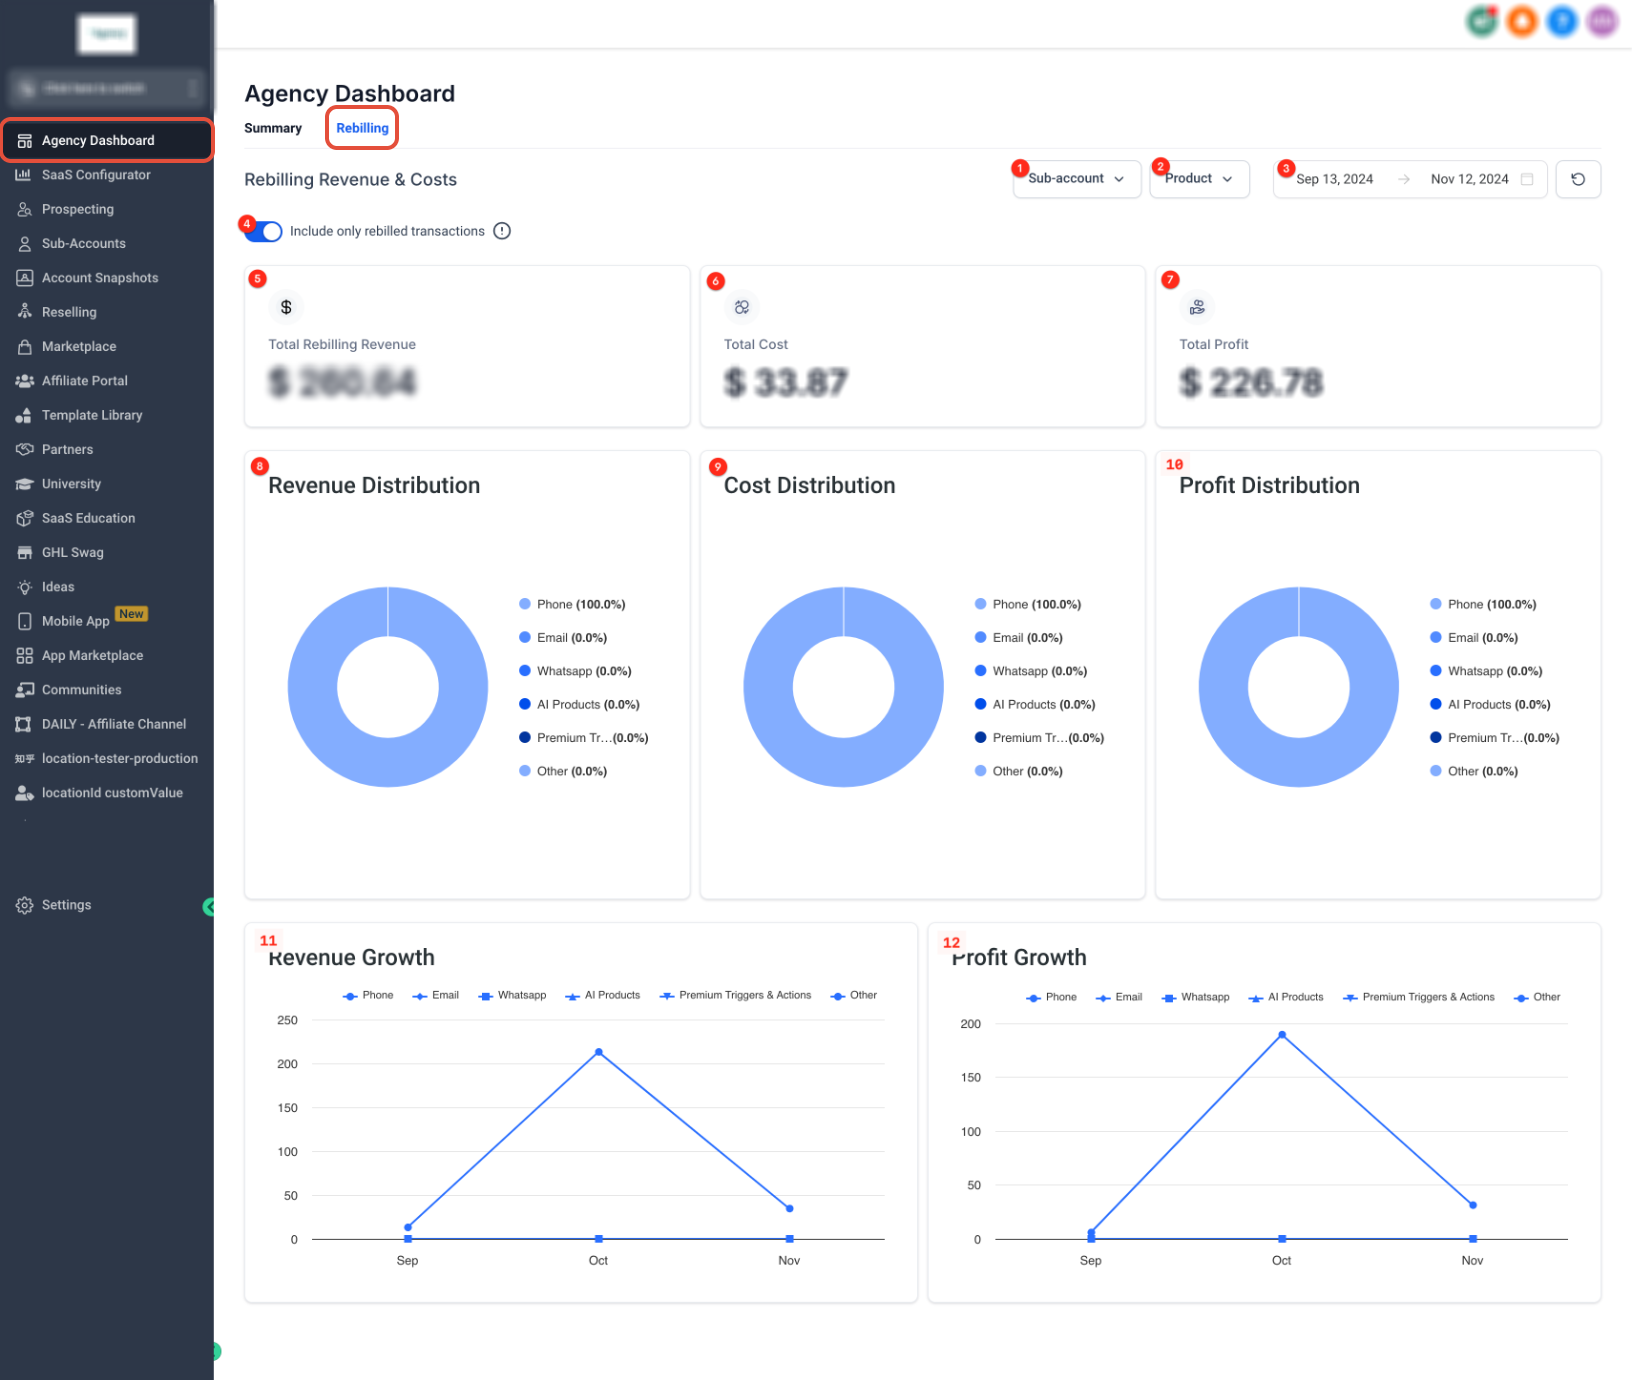
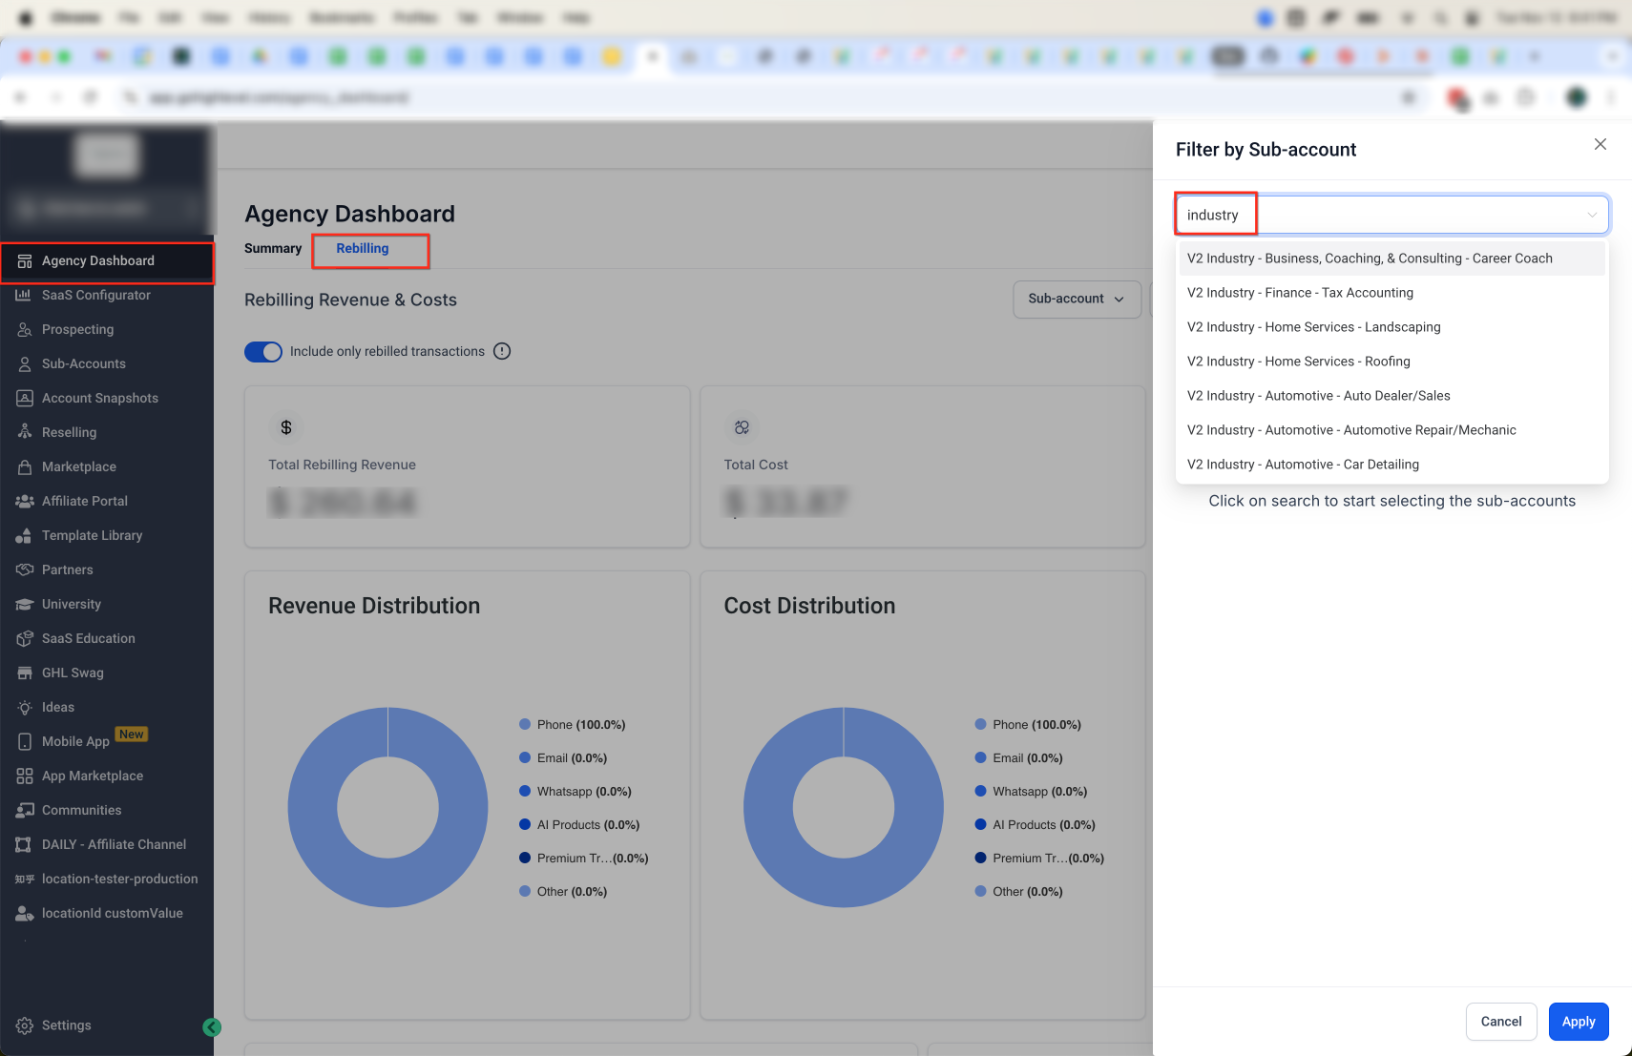
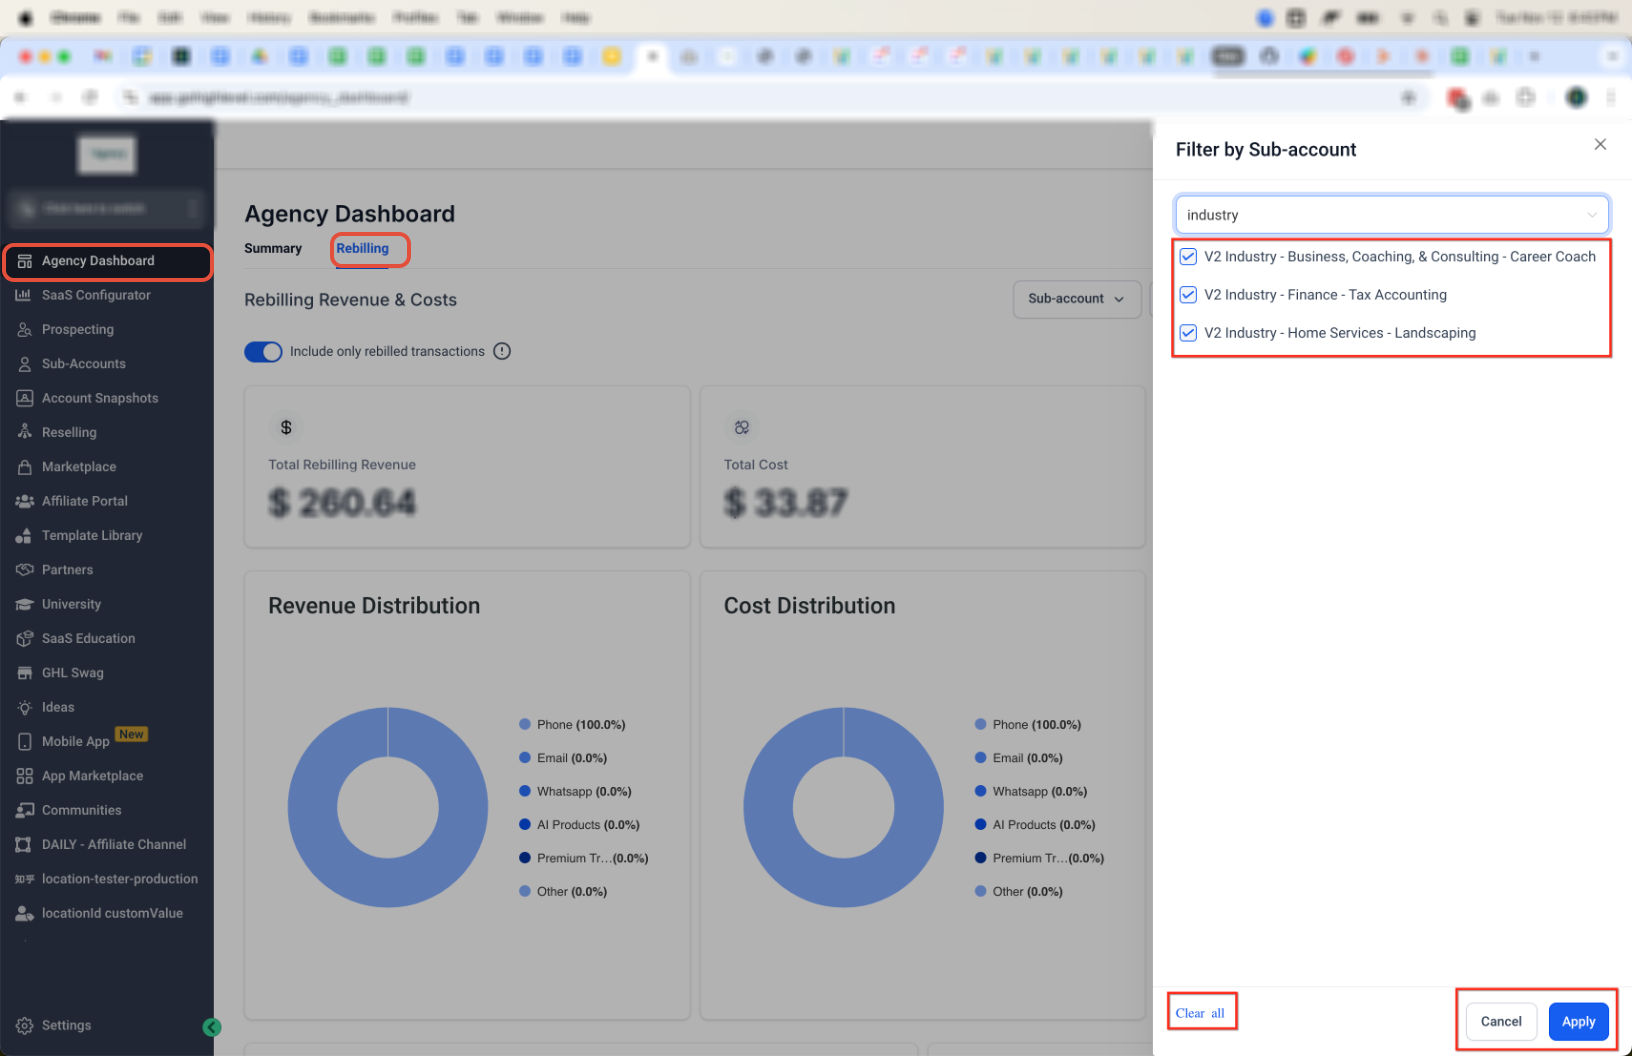
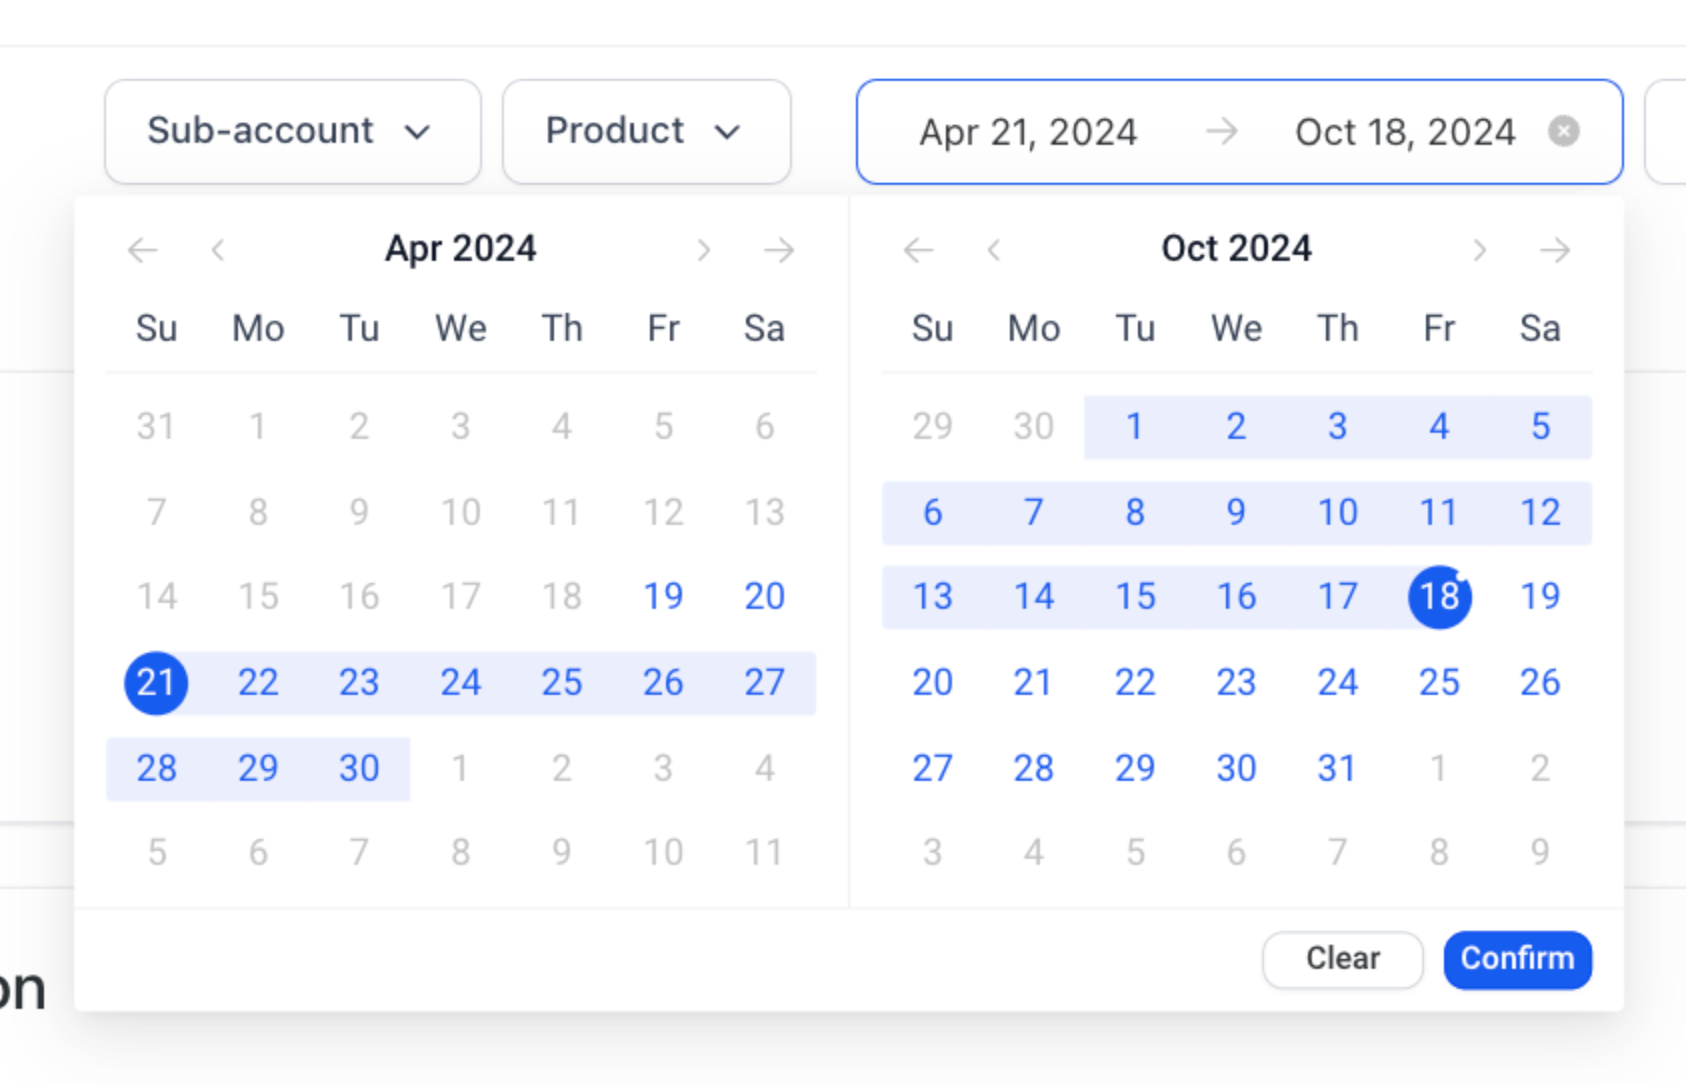
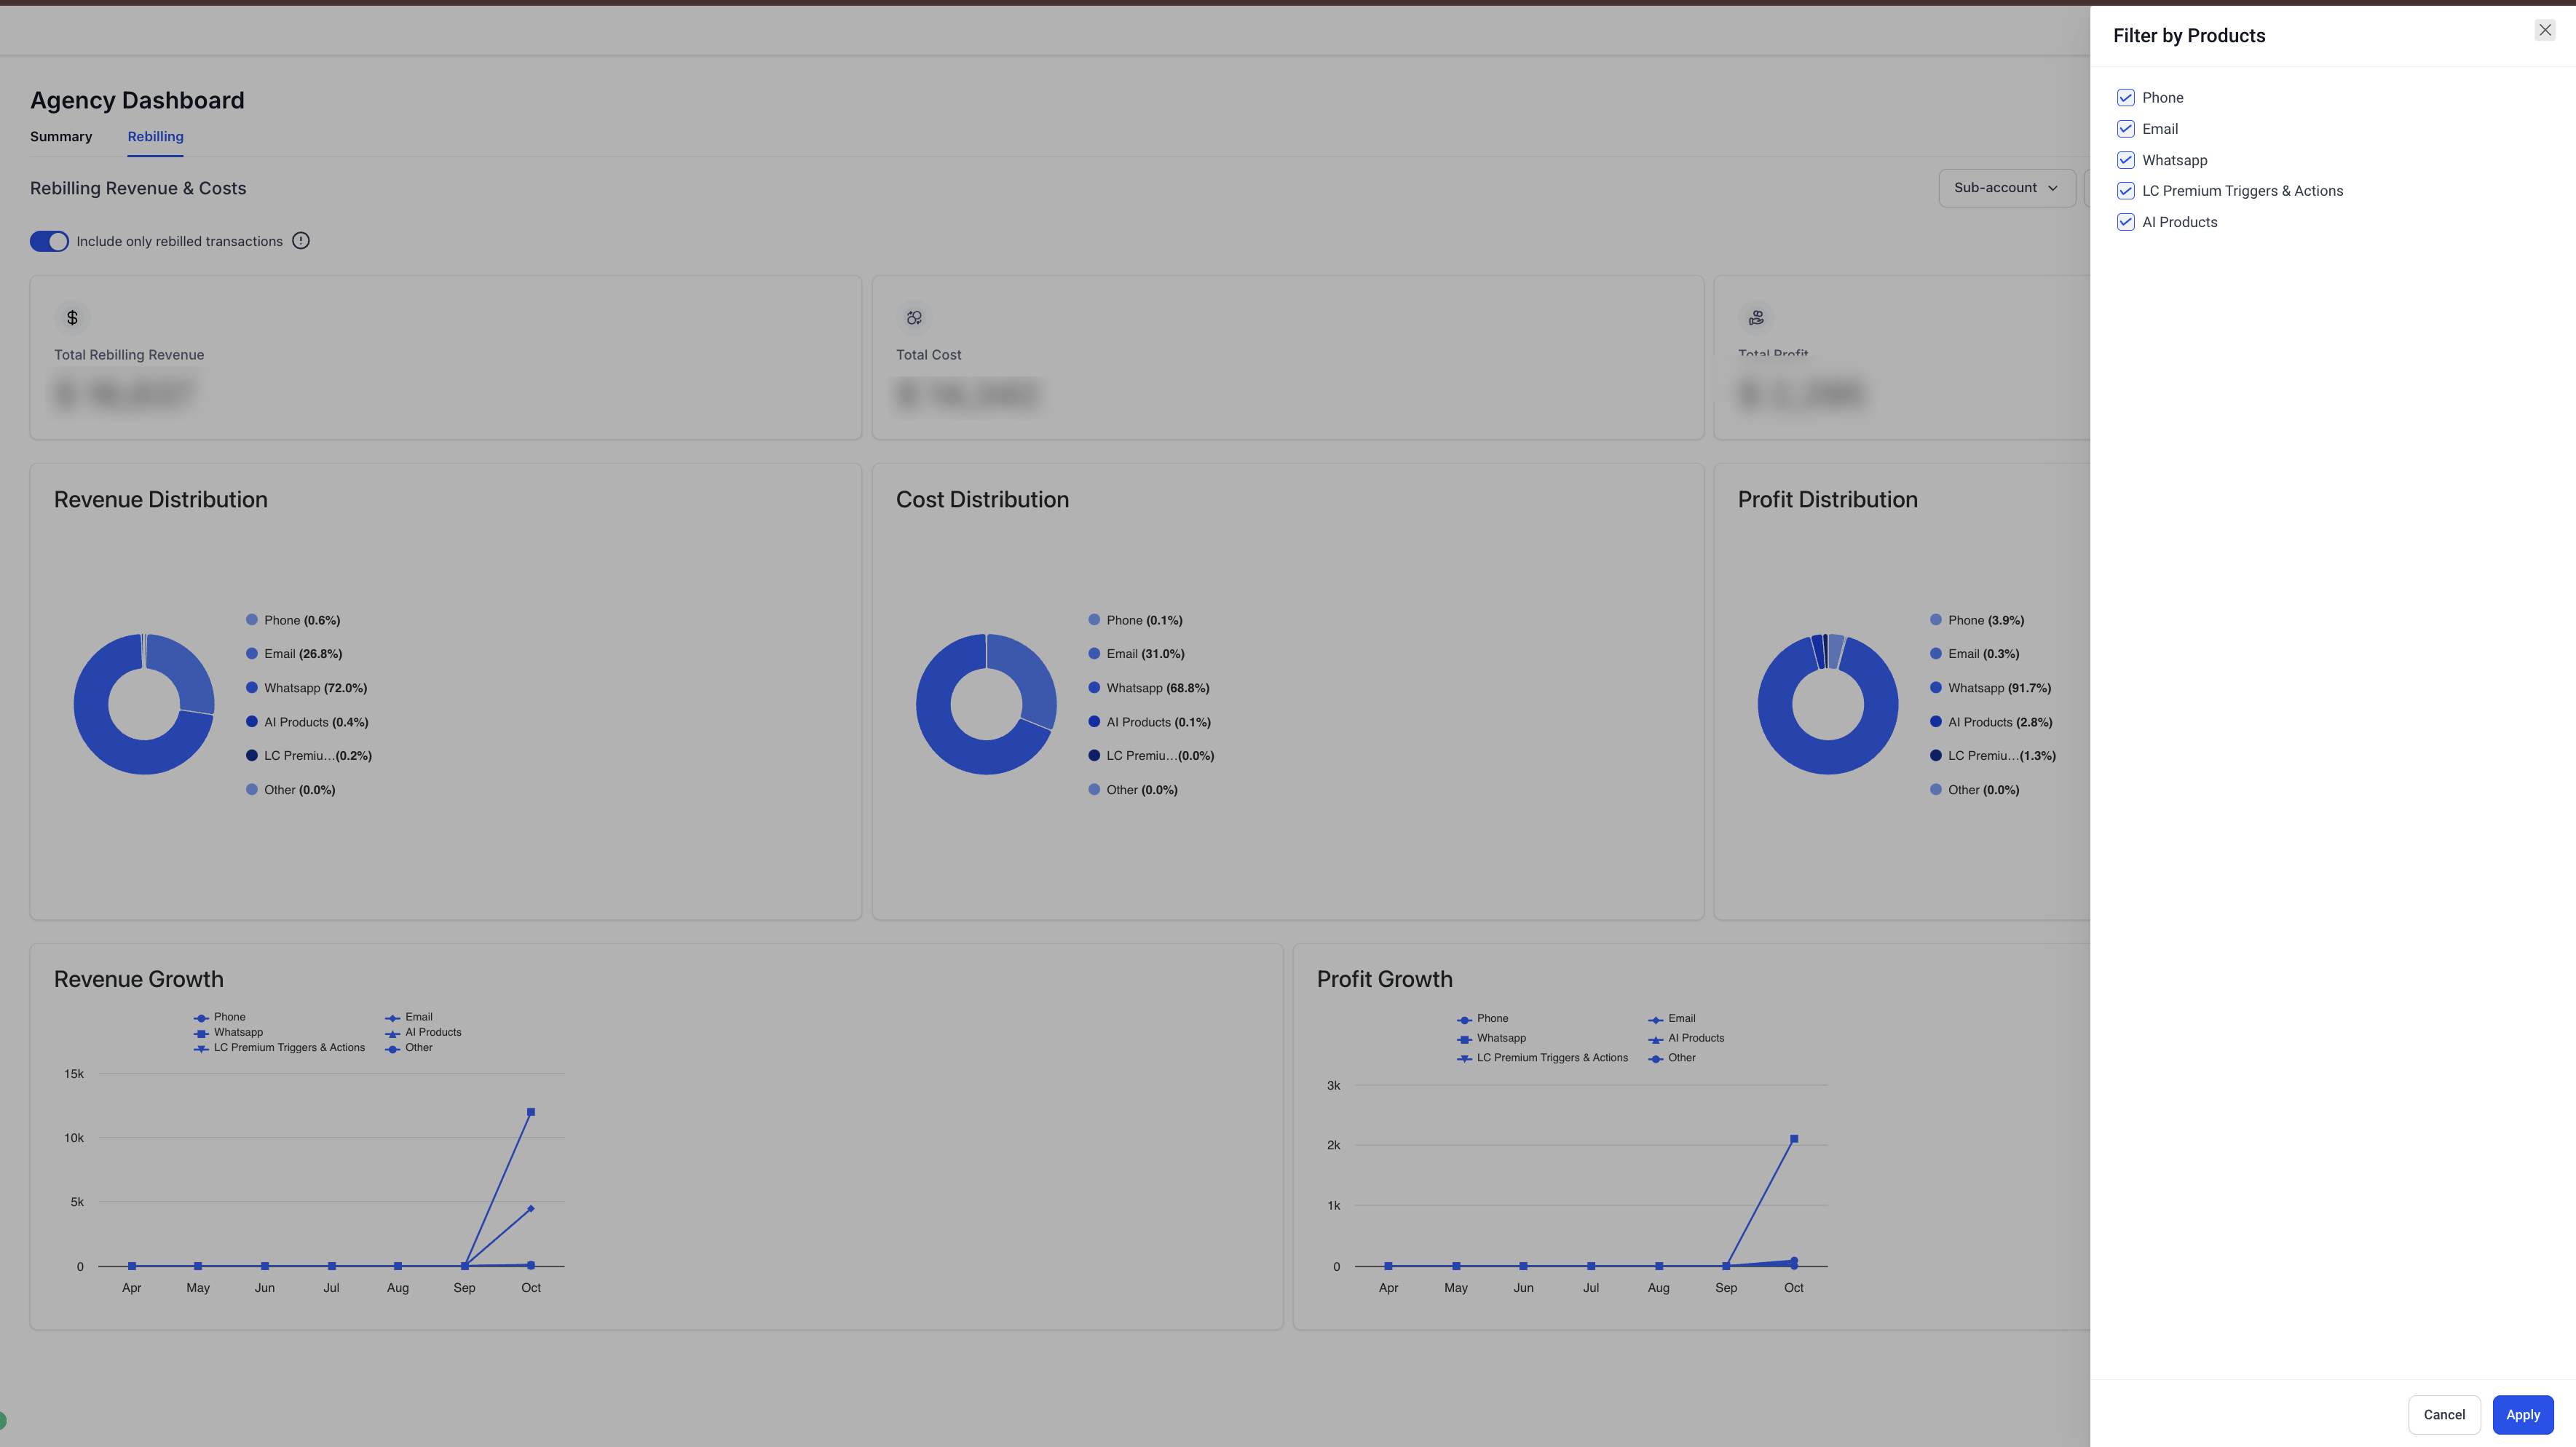
The Agency Dashboard – Rebilling tab provides a centralized view of your agency’s rebilling activity in Patient Copilot. It helps you track revenue, monitor vendor costs, and review overall financial performance across sub-accounts and services. You can filter data by sub-account, product category, and date range to analyze performance and trends. * * * ## Important - The dashboard displays data for the most recent six (6) months only - Negative revenue may appear due to cancellations, refunds, or prorated adjustments * * * ## Accessing the Rebilling Dashboard 2. Click Agency Dashboard from the left navigation 3. Select the Rebilling tab!(https://assets.patientcopilot.ai/336292708525155f.png) * * * ## Main Dashboard Overview The Rebilling Dashboard provides a high-level summary of your financial performance. - “Include only rebilled transactions” toggle - Summary cards for Revenue, Cost, and Profit - Growth charts * * * ## Filtering Your Data Filtering allows you to refine results by account, product, or time period. ### Sub-account Filter - Search and select one or more sub-accounts - Apply or clear selections as needed - Multiple selections combine data across accounts!(https://assets.patientcopilot.ai/ec24ebf563605fde.png) ### Product Filter Filter by service category such as: - LC Premium Triggers & Actions - AI Products!(https://assets.patientcopilot.ai/183988249070426b.png) ### Date Range Filter - Select a custom date range - Click Confirm to apply!(https://assets.patientcopilot.ai/9d09099b1946365d.png) * * * ## Filters and Controls Use the following controls: - Include only rebilled transactions toggle - Refresh These controls directly impact how totals are calculated and displayed.!(https://assets.patientcopilot.ai/71c8417965d0032a.png) * * * ### Summary Cards - Total Profit ### Charts - Profit Distribution ### Trends - Profit Growth * * * ## Include Only Rebilled Transactions - Only successfully charged transactions are included - Costs that were not rebilled may appear For accurate profit analysis, keep this enabled. * * * ## Reselling Reporting Layout - Usage Products → Pay-as-you-go services - Subscription Products → Recurring services * * * ## Understanding Financial Metrics - Revenue: Amount charged to clients - Cost: Amount charged by vendors - Profit: Revenue minus Cost > Profit = Revenue – Cost * * * ## Distribution Reports These charts show how revenue, cost, and profit are distributed across products. - High-cost services * * * ## Growth Reports Growth charts track performance over time. - Revenue Growth → income trends - Profit Growth → margin trends * * * ## Example Walk-Through - Profit: * * * ## Understanding Exported Data and Profit Breakdown The dashboard shows aggregated data, while exports contain raw transaction-level data. This difference can make exported files harder to interpret. ### Why Exported Data Feels Generalized - Profit may not appear as a column - Multiple rows may exist per client or service ### Key Fields in Exported Data - Date ### How to Calculate Profit 1. Open the CSV in Excel or Google Sheets 2. Locate Charge and Usage Cost ``` Profit = Charge – Usage Cost